To develop a systematic data-led approach for local economic development and capacitating cities for economic planning
LED
Context
The world is moving towards rapid urbanization. Cities in India that contribute to a significant portion of economic growth in a city, yet have little power in making decisions for economic planning, growth and development for themselves. As a result, one cannot assess if cities are harnessing their economic potential for their benefit. Economic planning and development has its own advantages - it impacts employment and poverty in a city and service delivery to its citizens. This project is building a Local Economic Intelligence Platform (LEIP) that will provide economic intelligence to cities aiding them to make decisions for economic development. It will also help investors who wish to invest in a city make informed decisions. Additionally, it serves as a data aggregation platform where one will find datasets and visualizations of economic indicators on a single platform.
LEIP conducts a Rapid Economic Assessment of the city to identify the gaps in its economy. It does cluster mapping and analysis and also finds out the comparative and competitive advantage of the city. With the help of the analysis given it has a Decision Support System that provides an intervention direction to the city officials and gives a city economic resilience score. Overall LEIP gives a direction to the city administrators, investors and other stakeholders involved in making economic decisions in a city and also provide a single platform for aggregation of data.
Problem Statement
Metropolitan cities contribute to more than half of India’s GDP yet the majority of them are ill-equipped to enhance their competitiveness, trace gaps within the local ecosystem or enable themselves to attract FDI that are required to aid the process of local economic development (LED). With resource constraints and lack of information, the process of planning for local economic development is found to be strenuous yet it is one of the mandatory functions of the local body. Cities are engines of economic growth in a country. In 2016, 300 of the largest metropolitan cities in the world contributed to 50% of global GDP. After the economic reforms of 1991, the Infrastructure Development in Mega Cities Project was launched by the then Ministry of Urban Affairs and Employment in 1992. Under this, a number of metropolitan cities were chosen to speed up infrastructure development aided by the Ministry alongside the industrial development carried out under the economic reforms. Subsequently the 74th Constitutional Amendment Act was passed in 1992. This Act recommended 18 functions that should be devolved to the city governments. One of these functions is ‘Planning for social and economic development’. City governments however, have not formulated economic plans. Largely, economic plans are made at the state and central level and cities bear little decision making power in terms of harnessing their economic potential. Economic planning has not yet been decentralised and localised. Another problem faced by cities is the lack of aggregation of data on a single platform that can be accessed by local body authorities.
Objective
The overarching objective of this project is to develop an economic intelligence platform at the local level that is backed by robust data analysis, visualisation and intervention direction for the city. It would assist in unveiling development strategies in order to leverage the existing yet unidentified comparative advantages. The platform will have the following objectives:
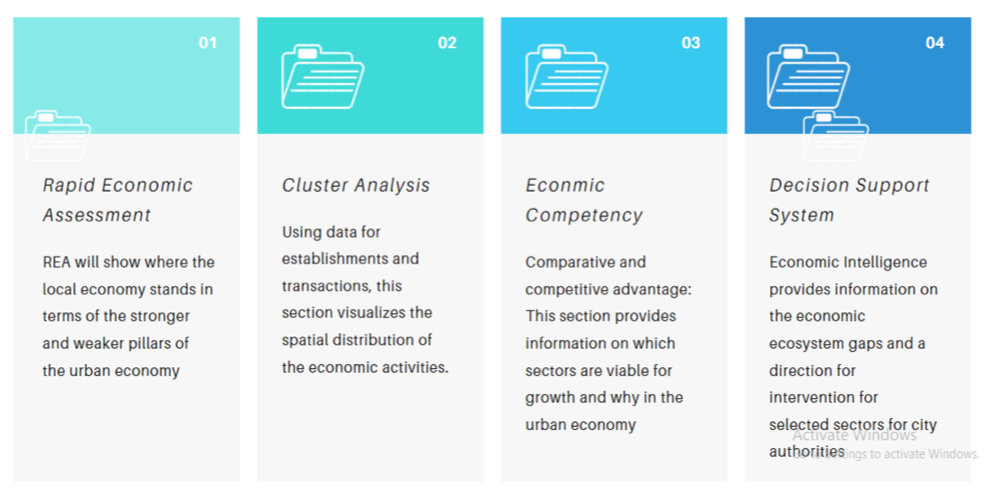
- Rapid Economic Assessment (REA): REA uses the Local Economic Development Framework to analyse the economic ecosystem to know for which of the four pillars of the economy intervention is required in the city. The four pillars of the economy are human capital, investment, infrastructure and policy variables.
- Cluster Analysis: This will include geographical mapping of clusters in the city and an analysis of the forward backward linkages of different clusters in the city. Data on taxation, import export and pin codes is used to make a cluster profile for the city so as to help investors make investment decisions.
- Economic Competency: Under this section, the comparative and competitive advantage of a city is analysed using the location quotient and shift share analysis using employment data. This section shows the economic competency and viability of the different sectors. It can also help authorities decide upon a viable economic sector which they can focus upon for growth.
- Decision Support System: This section uses the research conducted to identify gaps and provide intervention direction for an aspirational sector in an economy. It uses the LED framework to give an economic assessment of the sector against the four pillars of the economy and helps the city understand which pillar needs which level of intervention. Additionally it also gives a city economic resilience calculation that shows the level of dependency of the city on one or more sectors. Thus, this will give a direction to the city authorities to diversify investment for the productivity of a larger number of sectors.
Project Strategy
Pilot City Identification
The pilot city was identified in four stages. A number of cities were shortlisted from the SWOT analysis conducted by the cohort that required interventions in economic opportunities and employment. Further, they were divided into administrative capitals of the respective state, commercial capitals of the respective state and cities left behind. As part of the process, ecosystem variables like human capital, investment, infrastructure and policy variables and their indicators like education lead, employment, migration, foreign direct investment, building permissions, etc. were identified. Each of the shortlisted cities was checked for availability of data for these indicators. Through this exercise, it was found that Thiruvanathapuram has relatively more recent data documented and easily available for public use.
Project Development and Implementation

Expected Outcomes
This platform provides economic intelligence to city authorities and other stakeholders in a city like state departments, investors to make informed decisions for economic development. This platform will also serve as an aggregation of economic data. It will also give an insight into the existing gaps in the economy and provide an intervention direction to the city through a rapid economic assessment of the city. The city can choose an aspirational sector that it wishes to develop in the economy. The platform will assess the economic competency of that sector. Further, it will also provide the areas of intervention for the sector against the four pillars of the economy.
Actual Result
The team has developed the five tabs mentioned above: city profile, rapid economic assessment, cluster mapping, comparative and competitive advantage and economic advantage. The following are the results for Thiruvananthapuram city:
1) Rapid Economic Assessment:
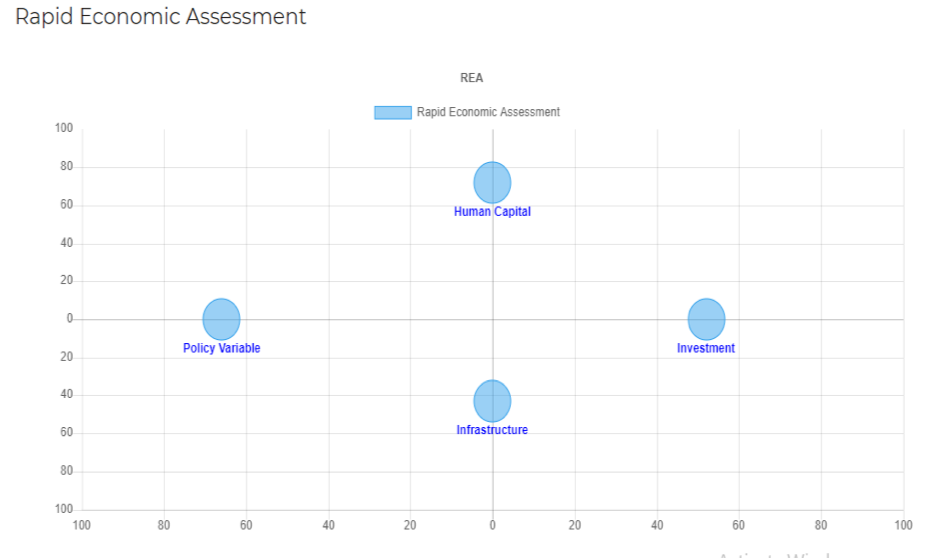
The REA tab gives an assessment of the city against the four pillars of the economy. The following are the results of REA:
| Pillar | Value |
|---|---|
| Human Capital | 72 |
| Infrastructure | 43 |
| Investment | 52 |
| Policy Variables | 66 |
The representative graph of the same on the website is given below.
This graph and the table show that Thiruvananthapuram is the strongest in Human Capital and weakest in infrastructure. It shows that the city has to take steps to improve its infrastructure in order to make the economic ecosystem conducive for growth. Similarly, investment also needs to be acquired from different sources for economic development of the city.
Additionally, the tab also includes visualizations for different datasets, thus making data easily readable to the users.
2) Cluster Analysis
The cluster analysis tab uses the data of the number of establishments and their related business to business transactions along with the goods movement from the Goods and Service Tax department of the city.
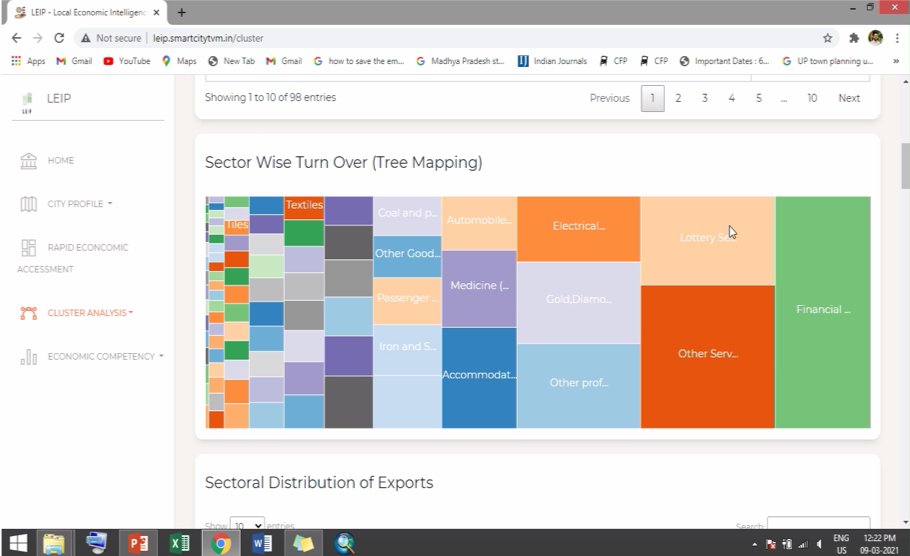
The cluster analysis provides information on the import and export potential of the city economic sectors and the forward and backward linkages of the city economy. It has 4 sub tabs: 1)) Sector wise turnover - The table and the visualized graph under this sub tab provides information on the prominent sectors of the economy based on the turnover. It was observed that Thiruvananthapuram has financial services and lottery as major economic activities based on the sectoral share.

ii) Sectoral distribution of exports - This sub tab provides information on the market outreach of the economic sectors that are distributing goods from outside the city - state and the nation. The sub tab has a visualised stacked bar graph showing the sectoral share of goods and services exported - within the state and outside the state based on CGST, SGST and IGST dataset. It can be inferred that financial services have the highest intrastate export followed by automobile spare parts.
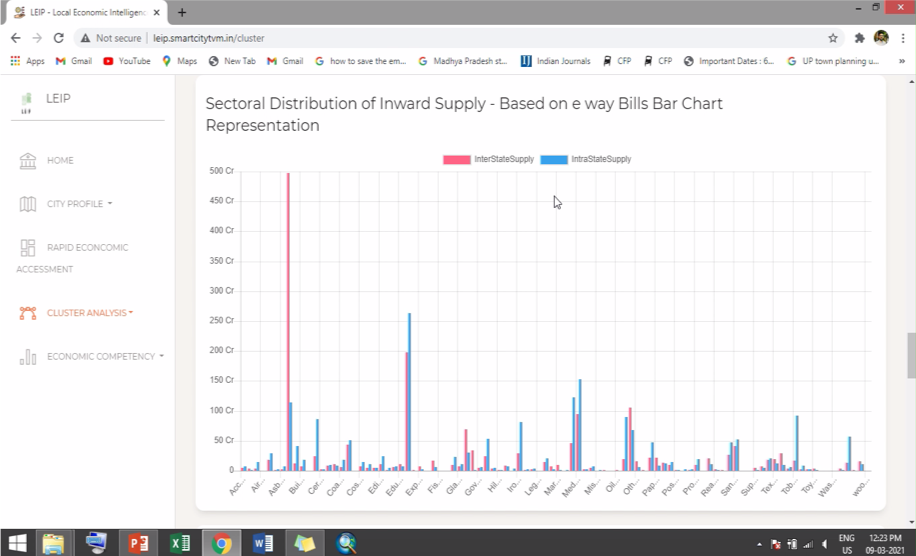
iii) ) Sectoral distribution of Inward supply - This visualization uses the data from the e way bills issued for the goods movement within India and their associated assessed value. This sub tab provides information on the market extent of goods that are being procured by the city of Thiruvananthapuram. The visualization associated is a stacked bar graph showing interstate and intrastate supply. It was observed that the food and pharma produce sector has the highest interstate import and support services, electronic goods and services intra-state supply.
iv) Sectoral distribution of Imports and Exports - This sub tab gives a holistic information on the sectoral distribution of goods and services imported and exported from/by the city of Thiruvananthapuram. It was observed that Medical and Pharmaceutical products have comparatively both higher import and export in Thiruvananthapuram.

3) City Competency
City Competency is the page that analyses the economic sectors according to the location quotient and shift share analysis. Taking the employment data from the economic census of India from 2005 and 2013, 73 divisional sectors of the economy are analysed for their comparative and competitive advantage. This has 2 sub tabs
i) Location Quotient - This tab provides information on the specialized sectors of the economy using the proportion of sectoral economic share of the city to that of the sectoral economic share of the state. It was observed that Computer Programming, Consultancy and related activities have a prominent share of employment with a LQ value of 10.08.
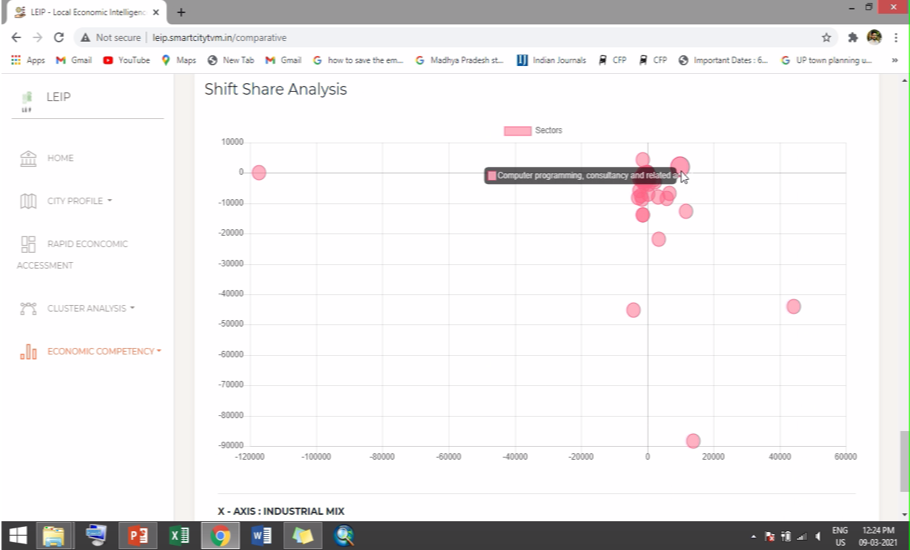
ii) Shift share analysis - This sub tab provides information on the proportional growth share of the economic sectors.

The tab uses two subcomponents of the analysis - Industrial mix and regional share. The industrial mix analyzes the difference in the economic sector growth of the region to that of the state. The regional share analysis the difference in the economic sector growth of the region to that of the overall economic growth of the state. This tab uses the visualization based on these two values and places the economic sectors in four quadrants.
The sectors in Q1 like computer programming, consultancy and related activities have both the values positive and represent a sustainable viable sector of the economy. Similarly, values in Q2 and Q4 represent those economic activities which have either regional importance or sectoral importance such as Crop and animal production, wholesale and retail trade

4) Decision Support System
The decision support system tab provides information on the potential sectors of development to the administrator along with the intervention direction for improvement in the economic ecosystem of the city. The administrator would use a login id to enter this page and would be able to seek information from the 3 sub tabs
i) Viability class analysis - Based on the economic competency analysis and the share of employment in the region this sub tab provides information on the viability classes of the economic sectors. Viability class 1 such as Computer Programming, Consultancy and related activities, travel agency, tour operators are those sectors which have a specialized economy in the city of Thiruvananthapuram. Similarly, the tab lists various economic activities in these four classes based on conditional rules that can be defined by the administrator.
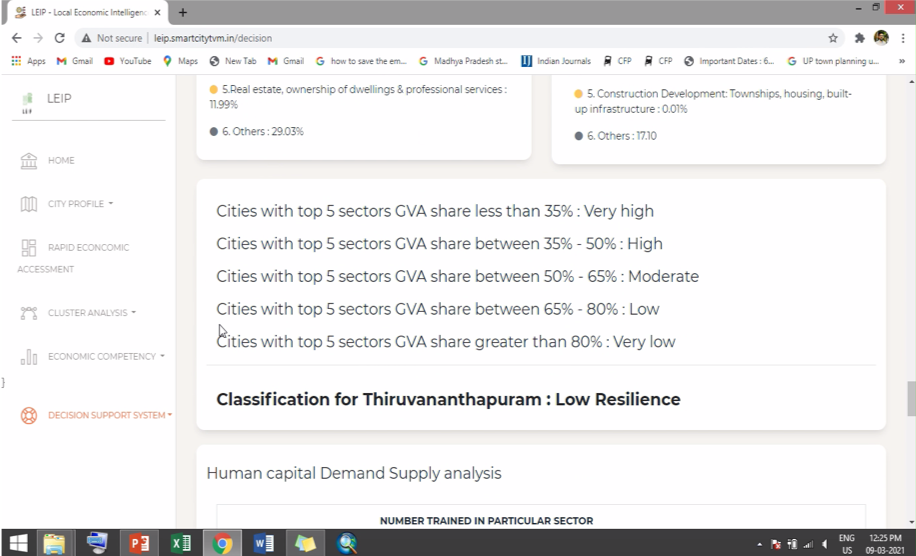
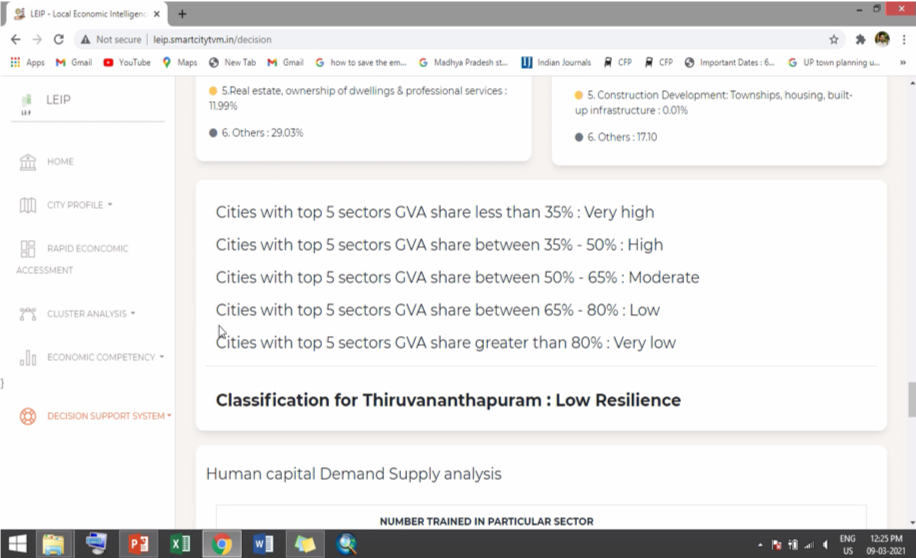
ii) City Economic Resilience Calculation - This sub tab uses the data on the GVA share of the economy and the FDI inflow to understand the resiliency of the economic ecosystem. The GVA share of top 5 sectors of the economy are added and based on its value in 5 classes over a scale of 0 to 100, resiliency of the city economy is studied from very low to very high. The city of Thiruvananthapuram has low resilience with a value of top 5 sectors GVA share as 70.97%.
iii) Human Capital Demand Supply Analysis - This tab visualises and provides information on the brain drain of the city economy using the data from demand in the economy for people and number of people trained in the particular sector. It was observed in the case of Thiruvananthapuram that industry demand for people with skills are higher in Advanced IT, services and rubber products but the training programmes were low. Whereas the Marketing and Basic IT have more people trained but less demanded by the industry.

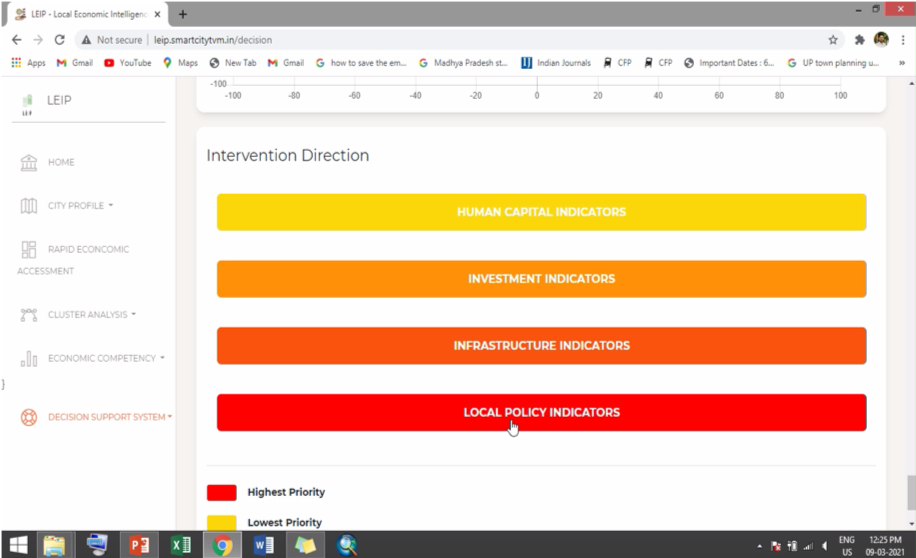
Furthermore, the tab provides information on the individual economic sector performance on the four axis pillar of rapid economic assessment as well as the intervention direction required under each. For the city of Thiruvananthapuram - the score value of Local policy is 72.36 and intervention direction shows missing policy lines such as land cost rebate linked to employment, recruitment assistance incentives etc. Whereas, the tab also provides information on those sections of the policy that are area specific such as power cost incentive, capital subsidy etc.

Conclusion
TThe components of LEIP are designed to aid policymakers, administrators, and elected representatives at the local and state level, and investors make informed decisions regarding economic development of the city. It is also a platform for data aggregation. LEIP can be further scaled up to other cities and a viable sector can be found for DSS. LEIP being a dynamic tool can be modified to suit the local context of the city. Depending on the data available in the city, indicators can be added or removed as per the city’s convenience. The tool is also being developed with an inbuilt reader that will read data from different data sources to input it automatically into the platform. Additionally, statistical analysis is being built-into LEIP so that it can automatically give results once data is read by the tool. This is being done to increase the scalability and replicability of LEIP.
The scope of LEIP can also be increased in numerous sectors to make the platform more holistic. Currently DSS is considering only sector - Information Technology for Thiruvananthapuram. Similarly, the scope will be increased to conduct DSS for more sectors in the city (here, Thiruvananthapuram) which will enrich the indicators used, research for them and the relationships existing between these indicators.
By increasing the sectoral scope of the tool along with scaling to other cities, LEIP will develop better economic complexities in a local economy. This will enrich the analysis and increase the data pool of the platform leading to accurate results. Hence, LEIP has a potential for scaling. In Phase II of the project, the team aims to collaborate with other organisations and replicate the tool for other cities and increase the scope by adding more sectors to the decision support system.