Monitoring crime through visualization and prediction in conjunction with the crime contributing factors of urban landscape.
S.A.C
Context
Many of today’s cities—especially those that are growing very quickly—experience a convergence of factors that increase the risk for destabilizing levels of violence if they are not appropriately addressed. In the present discourse of urban issues discussion, assessing cities through the lenses of safety against criminal offenses is necessary. As per the data published by the National Crime Record Bureau (NCRB), in 2019, the crime incidence per one lakh population has increased by two percent since 2018. The Indian Police Department is understaffed with a police-to-population ratio of 138 compared to the United Nations minimum standard of 222. An efficient policing using the power of data and technology can be used to derive maximum from the deficient departments.
Team Recon’s project - S.A.C. (Social Analytics for Crime), focuses on making smart cities safer for children. In this, crime heat mapping of the city is envisioned with the help of historic crime data which involves crime against children, and also socio-economic parameters and demography. Accordingly, a dashboard is to be developed for the ICCC unit (Integrated Control and Command Centre) for smart cities which will predict crime with the help of data interpretation and machine learning. This future prediction will be done with respect to the location, time, and type of incidence. As machine learning is used for data analysis, on data maturity, its accuracy for prediction will improve.
Currently, this project is only focusing on crime against children and the product is being developed for New Delhi Municipal Council Smart City Limited, pilot area being limited to the New Delhi zone, South Delhi Zone, South West Delhi Zone but in the future it has the purview of having a horizontal and vertical expansion. That means more types of crime can be added and more geographical areas could be covered under this project.
Problem Statement
Non-synchronized performance: Relative rankings of metropolitan cities in India based on crime rate (number of incidences per 1 lakh population) and Ease of Living Index shows a mismatch when studied. The cities that reported high crime rates are one of the top performers in the EoF and Municipal Performance Index. This study suggested that cities in India can perform better in terms of urban service delivery but at the same time can be less efficient in providing safety and security. Administrative efficiency in silos is not constructively helping in ensuring urban crime safety.
Socio-Economic conditions on crime rate: In environmental criminology researchers mainly focus on influences of socio-economic factors and spatial factors on crime. Understanding the urban context of crime occurrence is equally important to the steps taken to put violators under law. Several established theories like Social Disorganization Theories and Subculture Theories have tried to narrow it down. Depending upon the type of crime, they have their root-cause, say, violent crimes occurring due to adverse social environments where violence can be treated as normal. These correlations are well recognized and substantiated by various qualitative empirical researches.
Absence of a tool that compares crime to Socio-economic indicators of the city: In the present context when the correlation between socio-economic factors with crime is well established, a mismatch between relative rankings of ease of living and crime rate indicates the requirement of a tool that can inform ULBs about the impact of their activities on crime rates. A quantitative assessment tool is required for the precise correlation derivation leveraging ULB and Police Department Data.
Objective
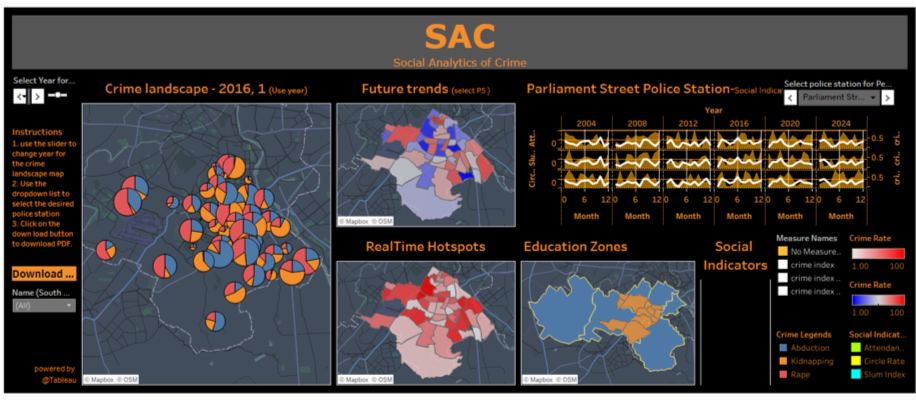
Spatial Visualization of crime: The tool will provide a spatial visualization of socio-economic factors and crime rates together to generate hotspot maps based on police station areas as a unit of spatial visualization.
Identification Relations and Generate Report: The tool will highlight critical socio-economic factors based on which crime hotspots have been generated. The tool will highlight administrative boundaries considered for each socio-economic factor for better comprehensibility of the furnished information. The tool will generate Alerts to ULB based on the prediction of crime hotspots. As a way forward, when integrated with Smart City MIS data, it can also compare total monetary investments in each sector with their respective indicators.
Predictive modeling of crime: The proposed tool will be integrated with machine learning-based data mining software which will generate mathematical models to calculate values of crime rate for prediction.
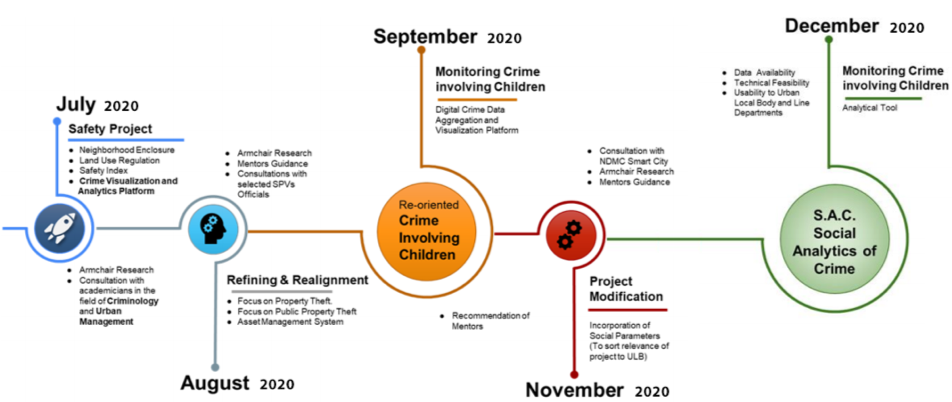
Project Strategy
Pilot City Identification
In order to cover all facets of the city dynamics and the ease of project propagation, seven indicators under 3 categories have been considered for city selection indexing. The three categories being Crime Reporting Criteria, Data Availability Criteria and Ease of Working Criteria.
Under Crime Reporting Criteria, indicators like Population, Weighted Means of Crime Rate against Children (2011-2018) and Weighted Means of Crime Rate in Juvenile Justice Act (2011-2018) were considered. Under Data Availability Criteria, indicators like Presence of Police Commissionerate and Use of CCTNS system to update data digitally, were considered. At last, under the Ease of Working Criteria, a five day moving average of COVID 19 cases reported and Presence of ICCC Unit in the smart city were considered. All the data was recorded in the Excel Sheet using secondary sources. Each of the indicator values were normalized between 0 – 1, followed by the calculation of cumulative score for each of the cities. The higher the cumulative score of the city, the more suitable the city is for the project pilot.
Probable Cities for Project Pilot in chronological order were Delhi, Nagpur, Chennai, Pune, Ahmedabad, Jaipur and Surat. All seven cities were contacted through City Buddy, assigned by the Ministry of Housing and Urban Affairs. Pune, Chennai and Surat did not show much interest in the project. Nagpur Smart City CEO was interested in the project idea and expressed willingness to develop on the idea more as per Nagpur city requirements. New Delhi was selected over Nagpur city considering the resource availability advantage of the city (guidance from NIUA and required push for data collection from Police Department through MoHUA).
Project Development and Implementation
Various ideas and probable project proposals related to crime, surveillance and safety were ideated upon in the course of project development. The project proposal has been modulated to sort relevance to the Urban Local body as the topic was seen to come into the ambit of the Police Department.
Expected Outcomes
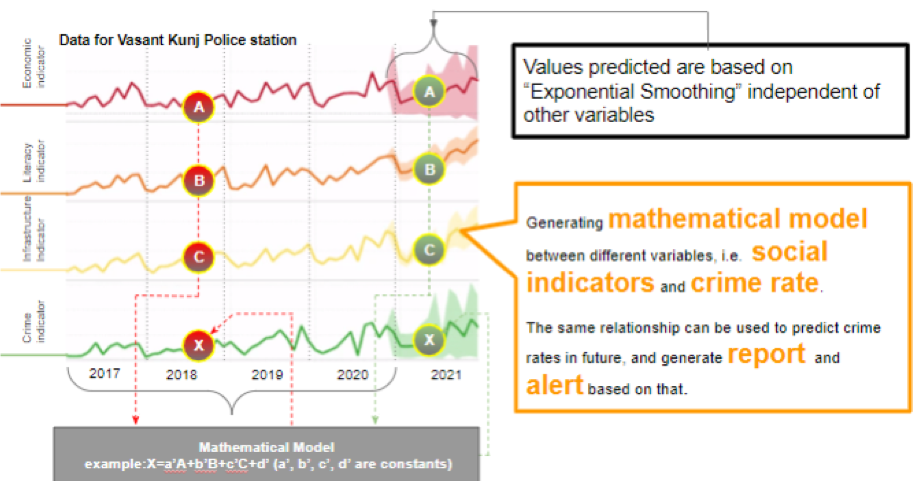
The SAC tool is expected to aggregate and standardize data related to Crime and Socio-Economic indicators collected from the Police Department and Urban Local Bodies line department. The tool will have spatial hot spot output in the form of a dashboard. Apart from routine analytics, it will create mathematical models between different Values of Indicator provided to the tool by using Machine Learning. The mathematical model generated works on regression modelling and basically it represents a function (f(x)), which helps to find out the value of dependent variables. Mathematical models will be used to predict the probable crime rate as per the administrative boundaries selected and related data analysed. The dashboard visualization which will allow the ULB and Police Department to see the impact of their ULB services and investment in different sectors on the crime rate and make decisions on safety provisions in the urban landscape.
Actual Result
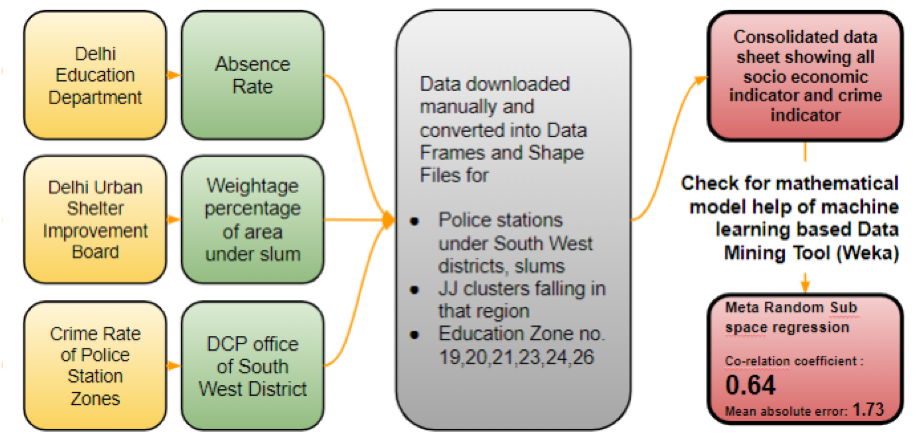
Designed the SAC dashboard and blueprint for the backend process of the tool to be completed. Front-end Graphical User Interface (GUI) has been designed for the Data Accumulator Portal, Results and Report portal and Dashboard. The data accumulator portal will also work as a data standardization portal. All the data is standardized and made co terminus to the boundary of Delhi Police Department zones, as the major data set (Crime) is collected based on its respective department boundary SAC accepts data in a predefined format containing time values, location values, and indicator values. Then a consolidated database containing all indicators is produced for the same period and geographical location using the values of all the indicators that have been provided by different agencies. The tool development part will start once an eligible developer is onboarded by the NDMC Smart City. The pilot stage team has validated the mathematical model by collating data from three departments and collected critiques on the same.

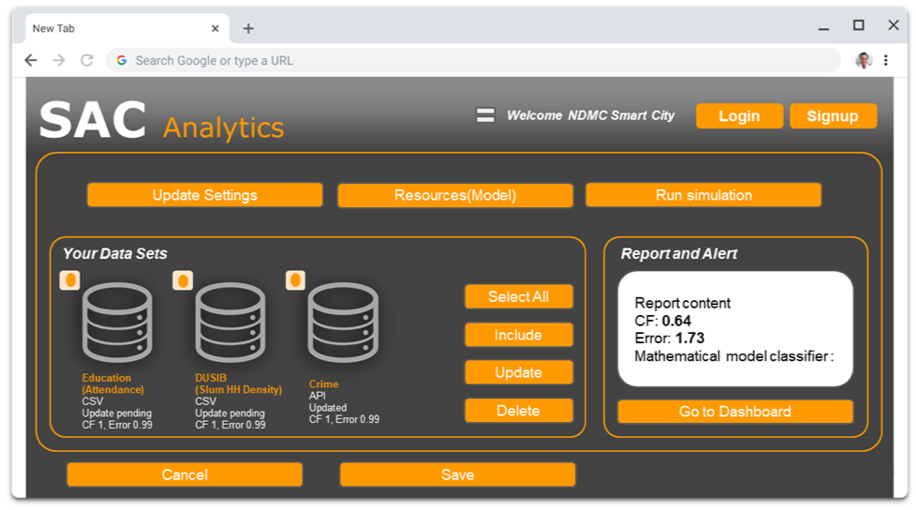
The data from Delhi Urban Shelter Improvement Board (DUSIB), Delhi Police Department - Southwest District, and Education Department of NDMC were collated manually from the online published data sets. The above departments were contacted to get access to their real-time database to be used as indicators for the proposed tool, however, it could not be materialised as envisioned. The team standardized the data set with the help of MS Excel, ArcGIS and My Maps (Google Maps) and created a Master data set which can be fed to the regression modeling tool. An open source machine learning tool called WEKA was used to run regression on the dataset. A mathematical model was generated, which has a Correlation coefficient of 0.64 and a mean root error of 1.7. Team Recon used this model to predict crime rates based on police station jurisdictions and found that every 2 out 3 times the predictions were correct.
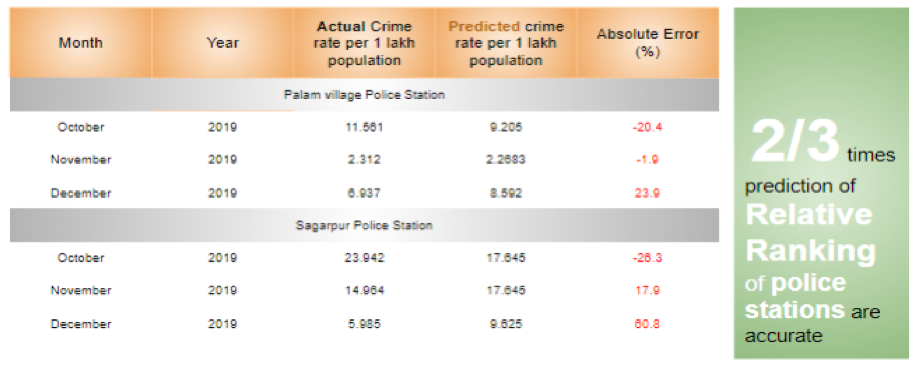
Below is the screenshot of the tool showing the predicted crime rate for two police stations of south-west Delhi for October, November, and December of 2019 with absolute error. From this chart, it is evident that the relative ranking of these police stations based on crime rate was correct 2 out of 3 times.
Some major challenges faced during the project piloting phase are: Collecting crime data from Police Department was a challenge as they were not ready to share the data for city governance (Breaking the siloed approach in the given timeframe was difficult), Data standardization on a single administrative boundary was tedious, Delay due to multiple administrative approvals, Reluctance of the NDMC IT Department to assist the team in developing the proposed tool, and Appointment / Onboarding of a Digital Tool Developer.
Conclusion
Team Recon’s project has a purview of vertical as well as horizontal expansion. Currently the project pilot is limited to Crime against Children and few Socio-Economic indicators and has spatial limitations in New Delhi, South Delhi and South West Delhi. This tool can be developed into a predictive modelling tool with the addition of more diverse types of crime, like property crime, crime against women etc. A greater number of socio-economic parameters can be deployed to the regression model to check its relation to crime occurrences. As the project is developed on open source, its source code can be downloaded by other smart cities and hosted on their ICCC unit and build more layers of analytics over the base source code.. This tool has the potential to help law enforcement and urban local bodies tackle the safety issues of the city and break departmental silos. SAC is the only solution to quantize the extent of relationship between socio-economic conditions of urban areas and crime occurrences, hence laying the foundation stone for predictive policing in coherence with the urban lifestyle complexity.