Dynamic tool to support decision making for urban water management while assuring sustainability and disaster risk reduction
REVIVE
Context
The continued rate of growth in India’s urban population has led to increased demand for water, particularly when compared to rural areas. In 2015, about 377 million Indians lived in urban areas and it is projected to hold 590 million by 2030. The drastic urbanisation comes at a huge cost to the fragile environment. Already, according to the National Sample Survey, only 47% of urban households have individual water connections and about 40% to 50% of water is reportedly lost in the distribution system due to various reasons. However, data such as water supply, groundwater, treated water, rainfall, etc. are scattered across various departments. This lack of an integrated urban water sector platform is addressed in our project aimed at helping ULB in making informed choices for water-related urban resilience.
This project is an effort towards driving authentic data-based decision making to avoid grave water problems in future.
Problem Statement
With the continued increase in urban water demand, it is estimated that the demand will increase by 80% by the year 2050. The urban demographic imbalance has led to increased demand for water. Apart from the increased demand, climate change has altered the natural seasonal timing and distribution of water; creating uncertainty, especially in parts of South Asia that are densely populated and highly rain-dependent. The UN's special rapporteur on human rights and extreme poverty warned of a ‘climate apartheid’, with climate change threatening to push more than 120 million people into poverty by 2030.
In recent years, many states in India have been facing water scarcity as well as urban flash floods during extreme rainfalls. As per NITI Aayog’s Report made on the basis of CWMI, 21 major cities were predicted to hit Day Zero by the current year i.e. 2020 as a result of lack of water management. Due to COVID-19, there are no updates on the water as the current situation has forced the administration to focus its attention on healthcare.
Viewing India’s history, it is indisputable that we have always faced floods and droughts, but with the rising climate change inducing uncertain rainfall patterns and more frequent cyclones; the problem has become more imminent and recurring. As per past events, it is identified that the problem of water scarcity and flooding are interrelated through the common chain being the rainfall. The major water source is rainfall, which if in excess then floods the streets during monsoon season and if not harvested then gives rise to water scarcity throughout the year.
There is an evident lack of high-resolution data sets which would enable us to take methodological actions to solve the root of the problem. Extreme climatic catastrophes of aridity, drought, flooding, cyclones and cloudburst are expected to leave an impact on human society in the long run for an unaccented period.
Objective
The project's aim is to provide a phase-wise strategy where the end product i.e., the dashboard ‘Revive’ would function as a decision support system for ULBs in order to make informed decisions and formulate strategies by facilitating the stakeholders with both monitoring and assisting in decision making related to urban water.
would enable ULBs to upload and access data to a single platform and use the reports to make informed decisions for the water sector. For citizens, it contains a segment for awareness and sensitization.
Phase 1 of the project involves;
- Aggregation of water sector data along with other relevant urban cross-sectoral datasets on a single software platform.
- Aid the city stakeholders in decision making related to urban water management by monitoring the water supply, usage, efficiency etc, and identify shortfalls in the region.
Phase 2 of the dashboard involves providing insight into future trends using predictive modelling based on the data fed in.
Project Strategy
Pilot City Identification
For identification of the pilot city where the project could be executed successfully, the team researched the cities that are facing a grave water crisis already. Out of 100 Smart Cities, 3 Cities i.e. Chandigarh, Pune and Jaipur were shortlisted on the basis of four parameters i.e. Water Infrastructure, Data Availability, Ease of Work and Potential Impact of the Dashboard. For the project pilot, a city that could have most of the ideal conditions for successful execution was chosen i.e. Chandigarh.
Designed on a grid-iron layout, Chandigarh is one of the early planned cities with sectoral land use patterns in post-independent India. Being a planned city it has a well-mapped water supply system, planned stormwater and sewerage network; factors that are critical for the dashboard. The city is also blessed with a rich set of archival data that would help in analysing the trends of various parameters over time. The city has also had limited expansion overtime, helping us to closely control the variables. Chandigarh is a city, district and most importantly a Union Territory enabling an administrative convenience that may not be possible in other cities. Currently, Chandigarh does not face issues such as flooding, severe groundwater depletion, drought, etc. This made it an ideal city in terms of data and variables. Thus, as a piloting project, data availability was prioritised over impact as it was to act as a lighthouse project for other cities to adapt.
Project Development and Implementation
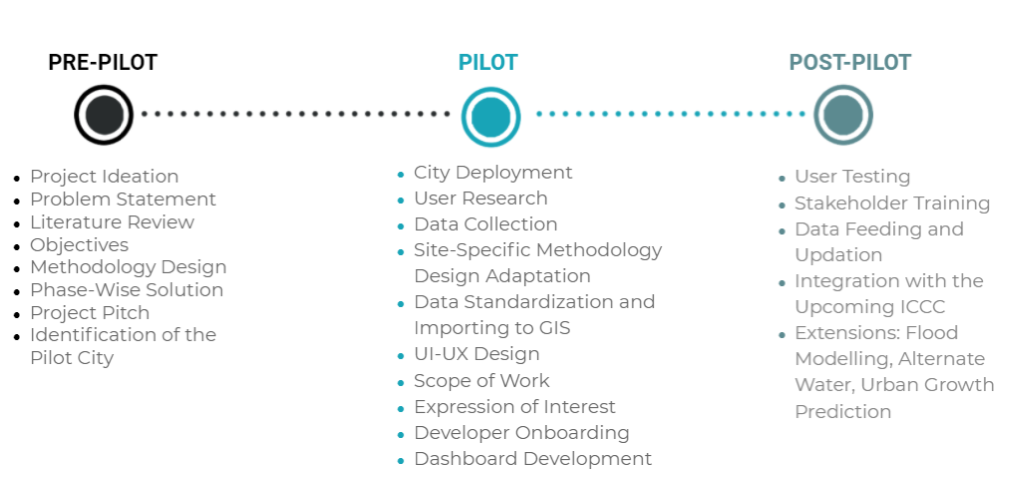
The project development happened in three major phases such as Pre-Pilot, Pilot and Post-Pilot. The various steps and processes undertaken in each phase are mentioned below.
Expected Outcomes
Revive’ dashboard would have the following outcomes;
- All water and other related sectoral datasets will be present on a single platform
- The existence of such a dashboard will cut down the steps to procure/access data for various works and for different stages of the project.
- The dashboard being dynamic in nature will facilitate real-time updation of data for taking decisions.
- In a situation where datasets are archived manually, initiation of such a system will now encourage archiving of datasets digitally.
- If historical datasets are absent, the initiation of such a system will now encourage archiving of datasets for future use.
- These datasets could be used for more possibilities in future rendering innovations.
- The archived datasets could be used for predictive modelling in the future.
Actual Result
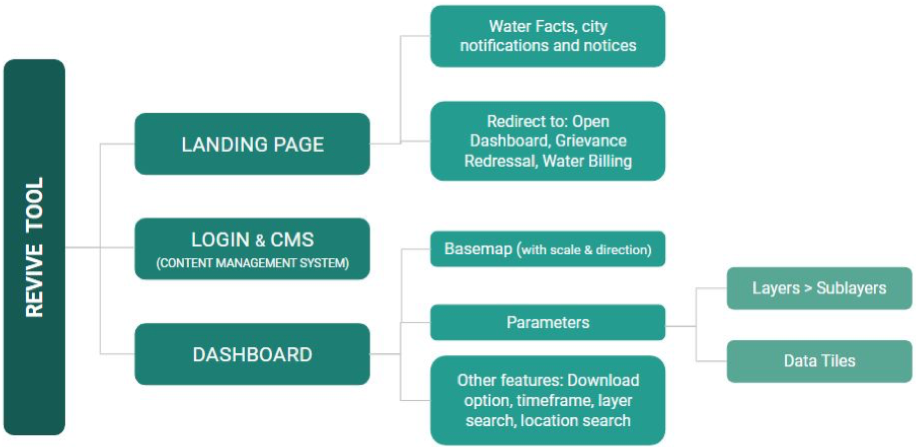
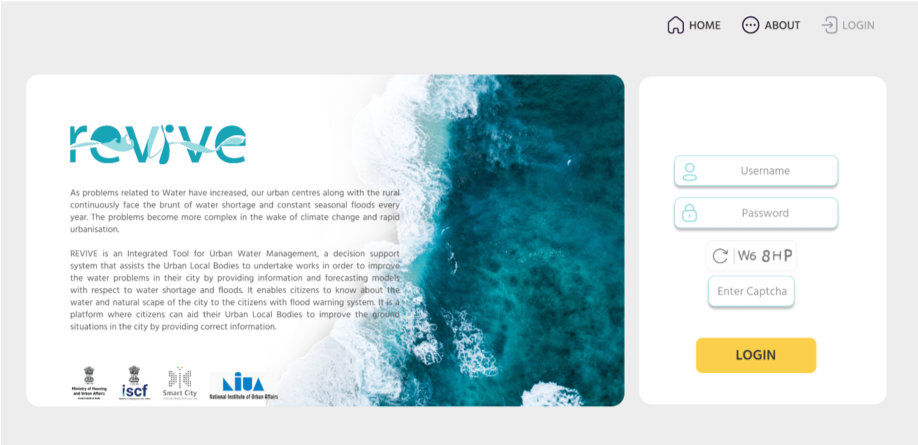
1. Landing Page
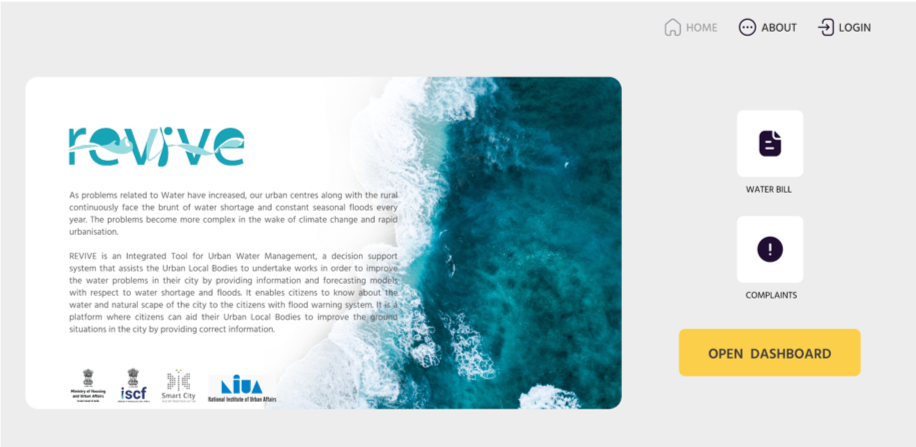
A landing page is where all the target users would start with. For citizens, it would display water-related notifications, redirects to water billing and grievance redressal portals. There is another section which, along with creating awareness regarding the water crisis, would also include DIY water-saving techniques and other practices to reduce wastage. Citizens will have access to a dashboard with limited datasets relevant to their needs. To complete the datasets, ULBs can log in using their credentials.
2. Dashboard
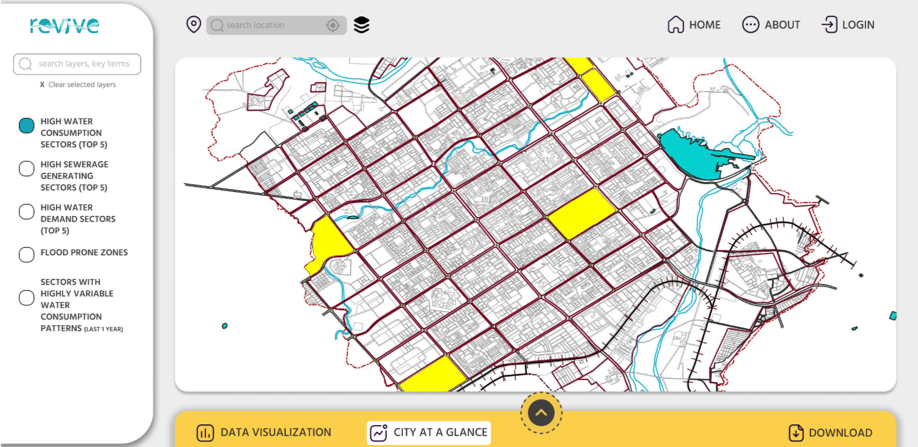
The dashboard will be an integration of all the available data layers in a WebGIS platform enabling ULB to monitor data in a spatial format, assisting in making informed choices on upgradation of infrastructure and policy, identifying shortfalls and improving water productivity
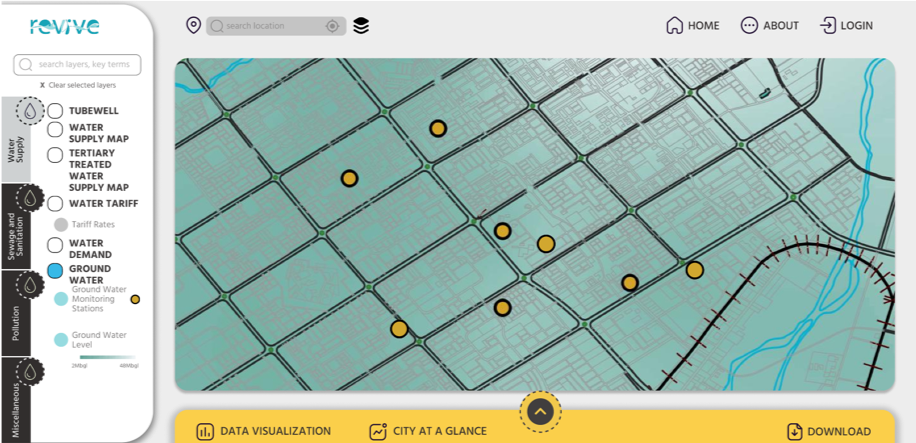
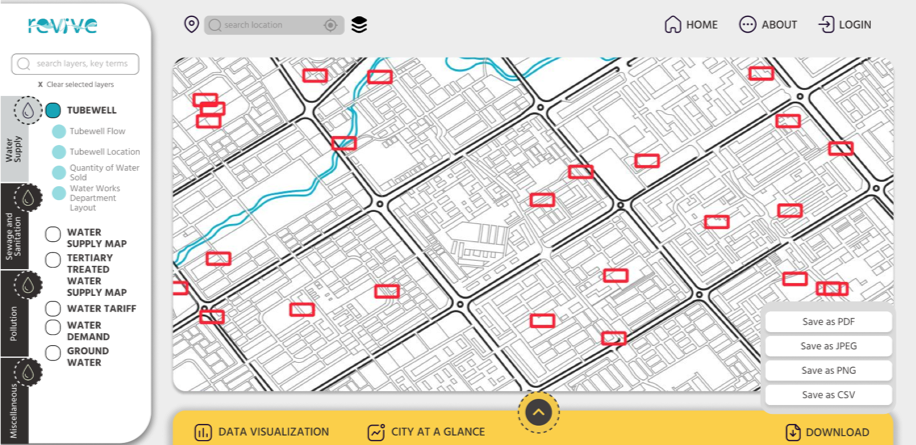
In the layer panel, the datasets are divided under four parameters: Water Supply, Sewage, Sanitation, Pollution, and Miscellaneous. Each parameter further lists multiple layers and sublayers. Users have the option to overlay multiple layers and sublayers by selecting each layer. There is also an option to download the displayed data in multiple image formats as well as pdf.
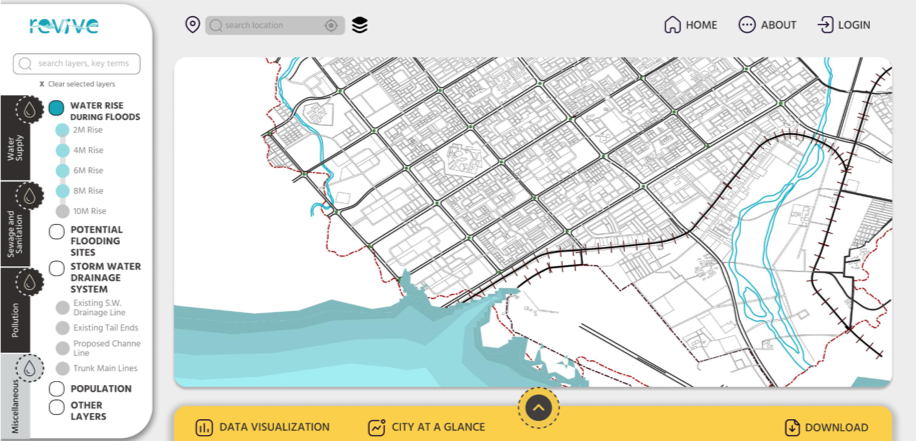
The dashboard also enables ULBs to identify the vulnerable areas of the city using flood simulation. By changing the level of water rise, the dashboard provides a visualization of areas prone to flooding and waterlogging.
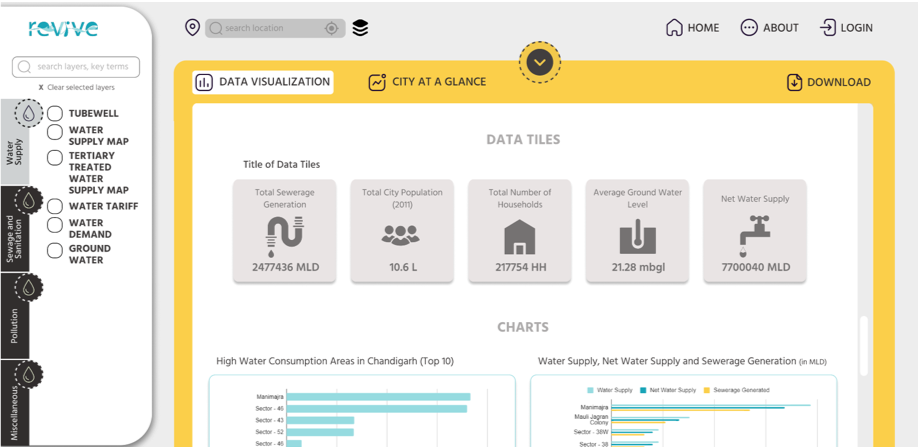
3. Dashboard reports (Data Visualization and City At A Glance):
This section of the dashboard will enable the user to deploy tools, generate reports and visualization based on the data assisting ULB to monitor and plan efficiently. Users will be able to access important statistical figures under ‘Data Tiles’. Data Visualization in the form of charts would be dynamic in nature and have a customization option where users can define the timeframe of the data.
City At A Glance: This section of the dashboard provides the users with a quick report of the city; highlighting top areas or sectors within the city which might require immediate attention based on various parameters.
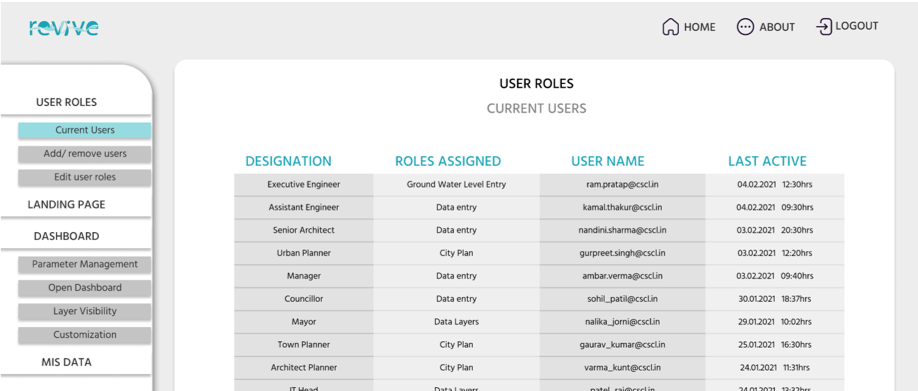
4. Content Management System:
Users are required to ‘log in’ in order to access the entire dashboard. The Content Management System (CMS) is designed for ULB to efficiently monitor and update data layers whenever required. This would also enable it to monitor and modify user roles, generate reports, add or modify parameters, approve updates from various users, etc.
Conclusion
Scalability/ Replicability: Cities rely on water-related data to improve water infrastructure and monitor efficiency. Being developed on an open-source platform, any city would be able to replicate and execute the tool with varying parameters and quality of data. Revive Tool can be implemented in pan-India with a provision to incorporate certain site-specific methodology adaptations of parameters based on regional systems, needs and aspirations. Such a tool could when implemented Pan India could help the Ministry to monitor unconventional parameters such as water productivity, water-use efficiency, crop water demand, drinking water supply rates, quality of supply, health indicators and environmental impacts that could assist in the development of improved ‘Composite Water Management Index’ (CWMI).
Way forward: Extensions: Flood modelling for mitigation planning, tapping alternate water resources, real-time monitoring using smart water systems, urban growth prediction, and assisting in the planning of Eco-DRR Infrastructure for the region