Introduction to Sustainable Development Goals
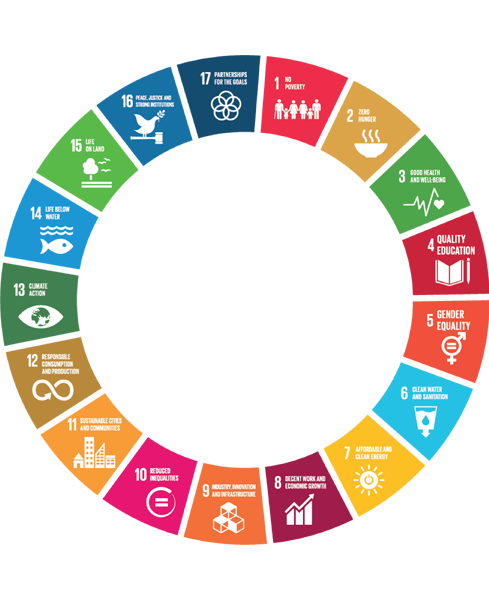
The Sustainable Development Goals (SDGs) are a universal plan for all countries to mitigate poverty, protect the planet and ensure prosperity for all. They are a set of 17 goals which include 169 targets, and 232 distinct indicators. India’s stand on SDGs affirms to its commitment for the goals of eradication of poverty, inclusive urban development and opportunities for all, enhancing productivity, increasing competitiveness and innovation, technological advancements, and urban resilience. The Government of India’s national policies, missions, and programmes—Smart Cities Mission, Atal Mission for Rejuvenation of Urban Transformation (AMRUT), Swachh Bharat Mission, Pradhan Mantri Awas Yojana, NULM, and Rurban mission—are the key ones consistent with the national goals. India ranks 117 and has an overall score index of 66 percent on the SDGs. The country has impressively progressed on the SDGs since its adoption in the year 2015. As per the NITI Aayog’s SDG Index Report 2021, the country has made a significant progress especially in SDG 1(no poverty), SDG 6 (clean water and sanitation), SDG 8 (decent work and economic growth), SDG 11 (sustainable cities and communities), and SDG 13 (climate action) between 2019 and 2020.

| National-level sub-goals | 1.1 | 1.2 | 1.3 | 1.4 | 1.5 | 1.6 | Indicators | Percentage of population living below the national poverty line | Head count ratio as per the Multi-dimensional Poverty Index (%) | Percentage of households with any usual member covered by a health scheme or health insurance | Persons provided employment as a percentage of persons who demanded employment under Mahatma Gandhi National Rural Employment Guarantee Act (MGNREGA) | Percentage of the population (out of total eligible population) receiving social protection benefits under Pradhan Mantri Matru Vandana Yojana (PMMVY) | Percentage of households living in katcha houses |
|---|---|---|---|---|---|---|
| India | 21.92 | 27.90 | 28.70 | 84.44 | 91.38 | 4.20 |
| Target | 10.96 | 13.95 | 100 | 98.95 | 100 | 0 |
Source: NITI Aayog.(2021). SDG India Index and Dashboard 2020-21: Partnerships in the Decade of Action,NITI Aayog, Government of India.
GOAL 1 |
|||
|---|---|---|---|
| CENTRE NAME | PROJECT NAME | LINKAGES TO SDG INDICATORS | LINKAGES TO GOVERNMENT OF INDIA'S MISSIONS (DIRECTLY/INDIRECTLY) |
Climate Centre for Cities |
Capacity Building for Low Carbon and Climate Resilient City Development in India |
SDG 1.5 | National Action Plan on Climate Change |
Inclusive Cities Centre |
Infant,Toddler and Caregiver-Friendly Neighbourhoods |
SDG 1.1, 1.2, 1.4, 1.b | Smart Cities Mission |
Center for Urbanization and Economic Growth |
Smart Data and Inclusive Cities |
SDG 1 | Smart Cities Mission |
India Smart Cities Fellowship Programme (Phase-II) |
SDG 1 | Smart Cities Mission | |
Sustainable, Healthy, Learning Cities and Neighborhoods |
SDG 1.2, 1.4, 1.5,1.b | Smart Cities Mission | |
Scale and Nature of Deprivation among Children and Adolescents in Urban India |
SDG 1.3, 1.4, 1.a, 1.b | Smart Cities Mission | |
Water & Environment |
Participatory and Inclusive Water Sensitive Urban Design for Sustainability and Resilience (PARIWAR) |
SDG 1.5 | Jal Jeevan Mission; AMRUT; Smart Cities Mission; National Urban Livelihood Mission |
| National-level sub-goals | 2.1 | 2.2 | 2.3 | |||||
|---|---|---|---|---|---|---|---|---|
| Indicators | Percentage of beneficiaries covered under National Food Security Act (NFSA), 2013 | Percentage of children under five years who are underweight | Percentage of children under five years who are stunted | Percentage of pregnant women aged 15-49 years who are anaemic | Percentage of adolescents aged 10-19 years who are anaemic | Rice and wheat produced annually per unit area (Kg/Ha) | Gross value added (constant prices) in agriculture per worker (in Lakhs/worker) | |
| India | 99.51% | 33.4% | 34.7% | 50% | 28.4% | 2,995 | ₹0.71 lakhs | |
| Target | 100% | 1.9% | 6.0% | 25.2% | 14.2% | 5,322.08 | ₹1.22 lakhs | |
Source: NITI Aayog.(2021). SDG India Index and Dashboard 2020-21: Partnerships in the Decade of Action,NITI Aayog, Government of India.
GOAL 2 |
|||
|---|---|---|---|
| CENTRE NAME | PROJECT NAME | LINKAGES TO SDG INDICATORS | LINKAGES TO GOVERNMENT OF INDIA'S MISSIONS (DIRECTLY/INDIRECTLY) |
Centre for Smart and Sustainable Cities |
Master Plan Delhi-2041 |
SDG 2 | SCM, AMRUT, PMAY |
| Inclusive Cities Centre | Infant,Toddler and Caregiver-Friendly Neighbourhoods |
SDG 2.1, 2.2,2.5 | Smart Cities Mission |
| Center for Urbanization and Economic Growth | India Smart Cities Fellowship Programme (Phase-II) |
SDG 2 | Smart Cities Mission |
Sustainable, Healthy, Learning Cities and Neighborhoods |
SDG 2.2 | Smart Cities Mission | |
Scale and Nature of Deprivation among Children and Adolescents in Urban India |
SDG 2.1, 2.2 | Smart Cities Mission | |
| National-level sub-goals | 3.1 | 3.2 | 3.3 | 3.4 | 3.6 | 3.7 | 3.8 | 3.c | ||
|---|---|---|---|---|---|---|---|---|---|---|
| indicators | Maternal Mortality Ratio (per 1,00,000 live births) | Under 5 mortality rate (per 1,000 live births) | Percentage of children in the age group 9-11 months fully immunized | Total cases notification rate of Tuberculosis per 1,00,000 population | HIV incidence per thousand uninfected population | Suicide rate (per 1,00,000 population | Death rate due to road traffic accidents (per 1,00,000 population) | Percentage of institutional deliveries out of the total deliveries reported | Monthly per capita out-of-pocket expenditure on health as a share of Monthly Per Capita Consumption Expenditure (MIPCE) | Total physicians, nurses and mid wives per 10,000 population |
| India | 113 | 36 | 91 | 177 | 0.05 | 10.4* | 11.56** | 94.4% | 13% | 37 |
| Target | 70 | 25 | 100% | 242 | 0 | 3.5 | 5.81 | 100% | 7.83% | 45 |
Source: NITI Aayog.(2021). SDG India Index and Dashboard 2020-21: Partnerships in the Decade of Action,NITI Aayog, Government of India.
*As reported by the National Crime Records Bureau, the suicide rate in India per 1,00,000 population in 2019 was 10.4.
**In 2019, 11.56 persons per 1,00,000 population died due to road traffic accidents as per the Accidental Deaths and Suicides in India Report of the National Crime Records Bureau.
GOAL 3 |
|||
|---|---|---|---|
| CENTRE NAME | PROJECT NAME | LINKAGES TO SDG INDICATORS | LINKAGES TO GOVERNMENT OF INDIA'S MISSIONS (DIRECTLY/INDIRECTLY) |
| Centre for Smart and Sustainable Cities | Master Plan Delhi-2041 | SDG 3 | SCM, AMRUT, PMAY |
| Inclusive Cities Centre | Infant,Toddler and Caregiver-Friendly Neighbourhoods | SDG 3 | Smart Cities Mission |
| Ahmedabad Walled City Heritage Trust | SDG 3.8 | Smart Cities Mission | |
| Climate Centre for Cities | City Investments to Innovate, Integrate & Sustain | SDG 3.8 | Smart Cities Mission |
| Center for Digital Governance | DataSmart Urban 95 | SDG 3.9 | National Urban Digital Mission; Smart Cities Mission |
| Center for Urbanization and Economic Growth | India Smart Cities Fellowship Programme (Phase-II) | SDG 3 | Smart Cities Mission |
| Sustainable, Healthy, Learning Cities and Neighborhoods | SDG 3.1, 3.2, 3.4, 3.5, 3.7, 3.8 | Smart Cities Mission | |
| Scale and Nature of Deprivation among Children and Adolescents in Urban India | SDG 3.2, 3.3, 3.4, 3.5,3.7, 3.8 | Smart Cities Mission | |
| Federal Institute for Research on Building, Urban Affairs & Spatial Development | SDG 3.2, 3.4, 3.6, 3.7,3.8 | Smart Cities Mission | |
| National-level sub-goals | 4.1 | 4.3 | 4.5 | 4.6 | 4.a | 4.c | |||||
|---|---|---|---|---|---|---|---|---|---|---|---|
| Indicators | Adjusted Net Enrolment Ratio (ANER) in elementary education (class 1-8) | Average annual dropout rate at secondary level (class 9-10) | Gross enrolment Ratio (GER) in higher secondary (class 11-12) | Percentage of students in grade VIII achieving at-least a minimum proficiency level in terms of nationally defined learning outcomes to be attained by the pupils at the end of the grade | Gross enrolment Ratio (GER) in higher education (18-23 years) | Percentage of persons with disability who have completed at-least secondary education (15 years and above) | GenderParityIndex(GPI) forHigher education(18-23 years) | Percent-age of persons who are literate (15 years and above) | Percentage of schools with access to basic infrastructure (electricity, drinking water) | Percent age of trained teachers at secondary level (class 9-10) | Pupil Teacher Ratio (PTR) at secondary level (class 9-10) |
| India | 87.26% | 17.87% | 50.14% | 71.9% | 26.3% | 19.3% | 01 | 74.6% | 84.76% | 83% | 21 |
| India | 1005 | 8.8% | 100% | 100% | 50% | 100% | 01 | 100% | 100% | 100% | 30 |
Source: NITI Aayog.(2021). SDG India Index and Dashboard 2020-21: Partnerships in the Decade of Action,NITI Aayog, Government of India.
GOAL 4 |
|||
|---|---|---|---|
| CENTRE NAME | PROJECT NAME | LINKAGES TO SDG INDICATORS | LINKAGES TO GOVERNMENT OF INDIA'S MISSIONS (DIRECTLY/INDIRECTLY) |
| Centre for Smart and Sustainable Cities | Master Plan Delhi-2041 | SDG 4 | SCM, AMRUT, PMAY |
| Inclusive Cities Centre | Infant,Toddler and Caregiver-Friendly Neighbourhoods | SDG 4.1, 4.2, 4.3,4.a, 4.b | Smart Cities Mission |
| Ahmedabad Walled City Heritage Trust | SDG 4.3 | Smart Cities Mission | |
| Climate Centre for Cities | City Investments to Innovate, Integrate & Sustain | SDG 4.a, 4.4 | Smart Cities Mission |
| Center for Urbanization and Economic Growth | Smart Data and Inclusive Cities | SDG 4.4 | Smart Cities Mission |
| Integrated Capacity Building Platform | SDG 4.7 | PMAY-U; Smart Cities Mission; HRIDAY; Swachh Bharat Mission; National Urban Livelihood Mission; AMRUT | |
| Scale and Nature of Depriviation among Children in Urban India | SDG 4.1, 4.5, 4.7 | Smart Cities Mission | |
| India Smart Cities Fellowship Programme (Phase-II) | SDG 4 | Smart Cities Mission | |
| Sustainable, Healthy, Learning Cities and Neighborhoods | SDG 4.1, 4.2, 4.3,4.5, 4.7, 4.a, 4.b | Smart Cities Mission | |
| Federal Institute for Research on Building, Urban Affairs & Spatial Development | SDG 4.1, 4.3, 4.5, 4.a | Smart Cities Mission | |
| Center for Digital Governance | DataSmart Urban 95 | SDG 4.2 | National Urban Digital Mission; Smart Cities Mission |
| National-level sub-goals | 5.1 | 5.2 | 5.5 | 5.6 | 5.a | ||||
|---|---|---|---|---|---|---|---|---|---|
| Indicators | Sex ratio at birth | Ratio of female to male average wage/salary earnings received among regular wage/salaried employees | Rate of crimes against women per 1,00,000 female population | Per lakh women who have experienced cruelty/ physical violence by husband or his relatives during the Year | Percentage of elected women over total seats in the state legislative assembly | Ratio of female to male Labour Force Participation Rate (LFPR) (15-59 years) | Proportion of women in managerial positions including women in board of directors, in listed companies (per 1,00 persons) | Percentage of currently married women aged 15-49 years who have their demand for family planning satisfied by modern methods | Operational land holding gender wise (percentage of female operated operational holdings) |
| India | 899 | 33%(Higher wages for men than women in rural and urban India) | 62 | 20 | 8.46% | 0.33 | 190 | 72% | 13.96% |
| Target | 950 | 1 | 0 | 0 | 50% | 1 | 245 | 100% | 50% |
Source: NITI Aayog.(2021). SDG India Index and Dashboard 2020-21: Partnerships in the Decade of Action,NITI Aayog, Government of India.
GOAL 5 |
|||
|---|---|---|---|
| CENTRE NAME | PROJECT NAME | LINKAGES TO SDG INDICATORS | LINKAGES TO GOVERNMENT OF INDIA'S MISSIONS (DIRECTLY/INDIRECTLY) |
| Centre for Smart and Sustainable Cities | Master Plan Delhi-2041 | SDG 5 | SCM, AMRUT, PMAY |
| Climate Centre for Cities | City Investments to Innovate, Integrate & Sustain | SDG 5.5 | Smart Cities Mission |
| Inclusive Cities Centre | Infant,Toddler and Caregiver-Friendly Neighbourhoods | SDG 5.1, 5.6, 5.a, 5.b,5.c | Smart Cities Mission |
| Center for Urbanization and Economic Growth | Smart Data and Inclusive Cities | SDG 5 | Smart Cities Mission |
| Sustainable, Healthy, Learning Cities and Neighborhoods | SDG 5.1, 5.2,5.6 | Smart Cities Mission | |
| Scale and Nature of Deprivation among Children and Adolescents in Urban India | SDG 5.1, 5.2, 5.3, 5.4,5.6, 5.c | Smart Cities Mission | |
| Federal Institute for Research on Building, Urban Affairs & Spatial Development | SDG 5.1 | Smart Cities Mission | |
| National-level sub-goals | 6.1 | 6.2 |
6.3 | 6.4 | 6.6 | |||
|---|---|---|---|---|---|---|---|---|
| Indicators | Percentage of rural population getting safe and adequate drinking water within premises through Pipe water Supply (PWS) | Percentage of rural population having improved source of drinking water | Percentage of individual household toilets constructed against target (SBM(G)) | Percentage of districts verified to be ODF (SBM(G)) | Percentage of schools with separate toilet facility for girls | Percentage of industries (17 category of highly polluting industries/ grossly polluting/ red category of industries) complying with waste water treatment as per CPCB norms | Percentage of ground water withdrawal against availability | Percent- age of blocks/ mandals/ taluka overexploited |
| India | 51.36% | 97.44% | 100% | 100% | 95% | 88.4% | 63% | 17.24% |
| Target | 100% | 100%% | 100% | 100% | 100% | 100% | 70% | 0% |
Source: NITI Aayog.(2021). SDG India Index and Dashboard 2020-21: Partnerships in the Decade of Action,NITI Aayog, Government of India.
GOAL 6 |
|||
|---|---|---|---|
| CENTRE NAME | PROJECT NAME | LINKAGES TO SDG INDICATORS | LINKAGES TO GOVERNMENT OF INDIA'S MISSIONS (DIRECTLY/INDIRECTLY) |
| Centre for Smart and Sustainable Cities | Master Plan Delhi-2041 | SDG 5 | SCM, AMRUT, PMAY |
| Climate Centre for Cities | Sanitation Capacity Building Platform | SDG 6.3 | NMCG;AMRUT;Swachh Bharat Mission; Jal Jeevan Mission; 15th Finance Commission |
| City Investments to Innovate, Integrate & Sustain | SDG 6.1,6.2 | Smart Cities Mission | |
| Swachh Bharat Mission | SDG 6 | ||
| Sustainable Cities Integrated Approach Pilot | SDG 6.3, 6.5,6.a, 6.b | Swachh Bharat Mission; AMRUT | |
| Safaimitra Suraksha Challenge | SDG 6.3, 6.5,6.a, 6.b | Swachh Bharat Mission | |
| ClimateSmart Cities Assessment Framework | SDG 6 | ClimateSmart Cities Assessment Framework | |
| Climate Centre for Cities | SDG 6.3.1, 6.3.2, 6.4.2, 6.5.1 | Smart Cities Mission;Swachh Bharat Mission;AMRUT | |
| Climate Smart Cities - GIZ | SDG 6.3 | ClimateSmart Cities Assessment Framework | |
| CIFF - Low carbon and climate resilient cities | SDG 6.1, 6.3, 6.4, 6.5, 6.6 | Smart Cities Mission;ClimateSmart Cities Assessment Framework | |
| CapaCITIES | SDG 6.3 | National Action Plan on Climate Change | |
| Inclusive Cities Centre | Infant,Toddler and Caregiver-Friendly Neighbourhoods | SDG 6.1, 6.2 | Smart Cities Mission |
| Ahmedabad Walled City Heritage Trust | SDG 6.1,6.2 | Smart Cities Mission | |
| Center for Urbanization and Economic Growth | Morgenstadt Global Smart Cities Initiative | SDG 6.A | Smart Cities Mission; PMAY-Urban |
| Integrated Capacity Building Program | SDG 6.B | PMAY-U; Smart Cities Mission; HRIDAY; Swachh Bharat Mission; National Urban Livelihood Mission; AMRUT | |
| India Smart Cities Fellowship Programme (Phase-II) | SDG 6 | Smart Cities Mission | |
| Sustainable, Healthy, Learning Cities and Neighborhoods | SDG 6.1, 6.2, 6.b | Smart Cities Mission | |
| Scale and Nature of Deprivation among Children and Adolescents in Urban India | SDG 6.1,6.2 | Smart Cities Mission | |
| Federal Institute for Research on Building, Urban Affairs & Spatial Development | SDG 6.1 | Smart Cities Mission | |
| Water & Environment | NMCG - Addressing the urban drivers of river health in Ganga Basin | SDG 6.3, 6.5, 6.6 | NMCG, AMRUT 2.0, SBM 2.0, National Greening Mission, National Water Mission, Atal Bhujal Yojana, CAMPA |
| Assessing the Efficacy and Efficiency of the Drink for Tap | SDG 6.1 | AMRUT 2.0 | |
| Developing an Urban Water Body Diadnostic Tool | SDG 6.3, 6.5, 6.6, 6.B | AMRUT 2.0, National Mission for Clean Ganga | |
| Participatory and Inclusive Water Sensitive Urban Design for Sustainability and Resilience (PARIWAR) | SDG 6.1, 6.3, 6.B | Jal Jeevan Mission; AMRUT; Smart Cities Mission; National Urban Livelihood Mission | |
| National-level sub-goals | 7.1 | |
|---|---|---|
| Indicators | Percentage of households electrified | Percentage of LPG+PNG connections against number of households |
| India | 99.99% | 2,824 Lakh LPG Connection 72 Lakh PNG Connections |
| Target | 100% | 100% |
Source: NITI Aayog.(2021). SDG India Index and Dashboard 2020-21: Partnerships in the Decade of Action,NITI Aayog, Government of India.
GOAL 7 |
|||
|---|---|---|---|
| CENTRE NAME | PROJECT NAME | LINKAGES TO SDG INDICATORS | LINKAGES TO GOVERNMENT OF INDIA'S MISSIONS (DIRECTLY/INDIRECTLY) |
| Climate Centre for Cities | ClimateSmart Cities Assessment Framework | SDG 7 | ClimateSmart Cities Assessment Framework |
| CapaCITIES | SDG 7.2 | National Action Plan on Climate Change | |
| CIFF - Low carbon and climate resilient cities | SDG 7.1, 7.2, 7.3,7.a, 7.b | Smart Cities Mission;ClimateSmart Cities Assessment Framework | |
| Climate Centre for Cities | SDG 7.2.1, | Smart Cities Mission;Swachh Bharat Mission;AMRUT | |
| Centre for Smart and Sustainable Cities | IIndia Smart Cities Fellowship Programme (Phase-II) | SDG 7 | Smart Cities Mission |
| Master Plan Delhi-2041 | SDG 7 | SCM, AMRUT, PMAY | |
| Federal Institute for Research on Building, Urban Affairs & Spatial Development | SDG 7 | Smart Cities Mission | |
| Center for Urbanization and Economic Growth | Morgenstadt Global Smart Cities Initiative | SDG 7.3 | Smart Cities Mission; PMAY-Urban |
| Sustainable, Healthy, Learning Cities and Neighborhoods | SDG 7.1 | Smart Cities Mission | |
| National-level sub-goals | 8.1 | 8.3 | 8.5 | 8.8 | 8.10 | ||||
|---|---|---|---|---|---|---|---|---|---|
| Indicators | Annual growth rate of GDP (constant prices per capita) | Ease of Doing Business (EODB) Score (feedback score) | Un-employment rate (%) (15-59 years) | Labour Force Participation Rate(LFPR) (%) (15-59 years) | Percentage of regular wage/ salaried employees in non-agriculture sector without any social security benefit | Percentage of households covered with a bank account under PMJ-DY against target | Number of functioning branches of commercial banks per 1,00,000 population | Automated Teller Machines (ATMs) per 1,00,000 population | Percent- age of women account holders in PMJDY |
| India | 5.1% | 71(2020) | 6.2% | 53.6% | 52% | 99.99% | 12 | 17 | 55.3% |
| Target | 7% | 50 | 3% | 68.3% | 0 | 100% | 31.26 | 42.65 | 50% |
Source: NITI Aayog.(2021). SDG India Index and Dashboard 2020-21: Partnerships in the Decade of Action,NITI Aayog, Government of India.
GOAL 8 |
|||
|---|---|---|---|
| CENTRE NAME | PROJECT NAME | LINKAGES TO SDG INDICATORS | LINKAGES TO GOVERNMENT OF INDIA'S MISSIONS (DIRECTLY/INDIRECTLY) |
| Centre for Governance and Municipal Finance | 14th Finance Commission Cell | SDG 8 | |
| Centre for Smart and Sustainable Cities | Master Plan Delhi-2041 | SDG 8 | SCM, AMRUT, PMAY |
| Inclusive Cities Centre | Ahmedabad Walled City Heritage Trust | SDG 8 | Smart Cities Mission |
| Infant,Toddler and Caregiver-Friendly Neighbourhoods | SDG 8.7 | Smart Cities Mission | |
| Shaping Youth Futures | SDG 8.5, 8.6 | National Urban Livelihood Mission | |
| Center for Urbanization and Economic Growth | Integrated Capacity Building Program | SDG 8.3 | PMAY-U; Smart Cities Mission; HRIDAY; Swachh Bharat Mission; National Urban Livelihood Mission; AMRUT |
| India Smart Cities Fellowship Programme (Phase-II)/td> | SDG 8 | Smart Cities Mission | |
| Sustainable, Healthy, Learning Cities and Neighborhoods | SDG 8.1, 8.3,8.5,8.8,8.10 | Smart Cities Mission | |
| Scale and Nature of Deprivation among Children and Adolescents in Urban India | SDG 8.3, 8.5, 8.6, 8.7, 8.8 | Smart Cities Mission | |
| National-level sub-goals | 9.1 | 9.2 | 9.5 | 9.C | |||
|---|---|---|---|---|---|---|---|
| Indicators | Percentageof targeted habitations connected by all-weather roads under Pradhan Mantri Gram Sadak Yojana (PMGSY) | Score as per Logistics Ease Across Different States (LEADS) report | Percentage Share of GVA in manufacturing to total GVA (current prices) | Manufacturing employment as a percentage of total employment | Innovation score as per the India Innovation Index | Number of mobile connections per 100 persons (mobile tele density) | Number of internet subscribers per 100 population |
| India | 98% | 44 (Rank) 3.18 (Score) | 16.1% | 12.07% | 48 (Rank) | 84 | 55 |
| Target | 100% | 5(Score) | 25% | 20% | - | 100 | 100 |
Source: NITI Aayog.(2021). SDG India Index and Dashboard 2020-21: Partnerships in the Decade of Action,NITI Aayog, Government of India.
GOAL 9 |
|||
|---|---|---|---|
| CENTRE NAME | PROJECT NAME | LINKAGES TO SDG INDICATORS | LINKAGES TO GOVERNMENT OF INDIA'S MISSIONS (DIRECTLY/INDIRECTLY) |
| Centre for Smart and Sustainable Cities | Master Plan Delhi-2041 | SDG 9 | SCM, AMRUT, PMAY |
| Climate Centre for Cities | Capacity Building for Low Carbon and Climate Resilient City Development in India | SDG 9 | |
| Sustainable Cities Integrated Approach Pilot | SDG 9 | ||
| CapaCITIES | SDG 9.a | National Action Plan on Climate Change | |
| Center for Urbanization and Economic Growth | Morgenstadt Global Smart Cities Initiative | SDG 9.4 | Smart Cities Mission; PMAY-Urban |
| India Smart Cities Fellowship Programme (Phase-II) | SDG 9 | Smart Cities Mission | |
| Sustainable, Healthy, Learning Cities and Neighborhoods | SDG 9.1, 9.c | Smart Cities Mission | |
| Scale and Nature of Deprivation among Children and Adolescents in Urban India | SDG 9.c | Smart Cities Mission | |
| National-level sub-goals | 10.1 | 10.2 | 10.3 | ||||
|---|---|---|---|---|---|---|---|
| Indicators | Percentage of population in the lowest two wealth quintiles | Percentage of elected women over total seats in the State/UT (Lok Sabha elections) | Percentage of seats held by women in Panchayati-Raj Institutions (PRIs) | Percentage of SC/ST seats in State Legislative Assemblies | Ratio of transgender to male Labour Force Participation Rate (LFPR) (15 years and above) | Rate of total crimes against SCs (per 1,00,000 SC population) | Rate of total crimes against STs (per 1,00,000 ST population) |
| India | 75% (in Bihar) 3.2% (in Kerala) | 14.39%* | 45.62% | 28.35% | 64% | 23 | 8 |
| Target | 4.67% | 50% | 33% | - | 1 | 0 | 0 |
Source: NITI Aayog.(2021). SDG India Index and Dashboard 2020-21: Partnerships in the Decade of Action,NITI Aayog, Government of India.
*The total seats in the 2019 Lok Sabha elections were won by women.
GOAL 10 |
|||
|---|---|---|---|
| CENTRE NAME | PROJECT NAME | LINKAGES TO SDG INDICATORS | LINKAGES TO GOVERNMENT OF INDIA'S MISSIONS (DIRECTLY/INDIRECTLY) |
| Centre for Governance and Municipal Finance | Integrated Capacity Building Platform | SDG 10.4 | PMAY-U; Smart Cities Mission; HRIDAY; Swachh Bharat Mission; National Urban Livelihood Mission; AMRUT |
| Centre for Smart and Sustainable Urbanization | Master Plan Delhi-2041 | SDG 10 | SCM, AMRUT, PMAY |
| Smart Data & Inclusive Cities | SDG 10 | Smart Cities Mission | |
| Inclusive Cities Centre | Building Accessible, Safe & Inclusive Indian Cities | SDG 10 | |
| Ahmedabad Walled City Heritage Trust | SDG 10.7 | Smart Cities Mission | |
| Shaping Youth Futures | SDG 10.2,10.3 | National Urban Livelihood Mission | |
| Center for Urbanization and Economic Growth | India Smart Cities Fellowship Programme (Phase-II) | SDG 10 | Smart Cities Mission |
| Sustainable, Healthy, Learning Cities and Neighborhoods | SDG 10.1, 10.2, 10.7 | Smart Cities Mission | |
| Scale and Nature of Deprivation among Children and Adolescents in Urban India | SDG 10.1, 10.2 | Smart Cities Mission | |
| National-level sub-goals | 11.1 | 11.2 |
11.6 | |||||
|---|---|---|---|---|---|---|---|---|
| Indicators | Percentage of urban households living in katcha housesz | Percentage of urban households with drainage facility | Percentage of individual household toilets constructed against target (SBM(U)) | Deaths due to road accidents in urban areas (per 1,00,000 population) | Percentage of wards with 100% door to door waste collection (SBM(U)) | Percentage of MSW processed to the total MSW generated (SBM(U)) | Percentage of wards with 100% source segregation (SBM(U)) | Installed sewage treatment capacity as a percentage of sewage generated in urban areas |
| India | 0.8% | 87.6% | ** | 12 | 97% | 68.1% | 78.03% | 39% |
| Target | 0 | 100% | 100 | 7.05 | 100% | 100% | 100% | 100% |
Source: NITI Aayog.(2021). SDG India Index and Dashboard 2020-21: Partnerships in the Decade of Action,NITI Aayog, Government of India.
**6.2 million individual household toilets have been constructed in urban India under the SBM (U) against a target of 5.9 million toilets.
SDGs Publications
GOAL 11 |
|||
|---|---|---|---|
| CENTRE NAME | PROJECT NAME | LINKAGES TO SDG INDICATORS | LINKAGES TO GOVERNMENT OF INDIA'S MISSIONS (DIRECTLY/INDIRECTLY) |
| Center for Urbanization and Economic Growth | Integrated Capacity Building Platform | SDG 11.3, 11.4 | PMAY-U, Smart Cities Mission, HRIDAY, Swachh Bharat Mission,National Urban Livelihood Mission, AMRUT |
| Morgenstadt Global Smart Cities Initiative | SDG 11.3, 11.b | Smart Cities Mission; PMAY-Urban | |
| Smart Data and Inclusive Cities | SDG 11.3, 11.5, 11.b | Smart Cities Mission | |
| India Smart Cities Fellowship Programme (Phase-II) | SDG 11 | Smart Cities Mission | |
| Smart Move: Innovative Urban Mobility Challenege 2020-21 | SDG 11.2 | Smart Cities Mission | |
| Sustainable, Healthy, Learning Cities and Neighborhoods | SDG 11.1, 11.2, 11.3, 11.4, 11.5, 11.6, 11.7, 11.b | Smart Cities Mission | |
| Scale and Nature of Deprivation among Children and Adolescents in Urban India | SDG 11.1, | Smart Cities Mission | |
| Federal Institute for Research on Building, Urban Affairs & Spatial Development | SDG 11.1, 11.2, 11.3, 11.6, | Smart Cities Mission | |
| Centre for Smart and Sustainable Cities | Master Plan Delhi-2041 | SDG 11 | SCM, AMRUT, PMAY |
| Climate Centre for Cities | Sanitation Capacity Building Platform | SDG 11 | NMCG;AMRUT;Swachh Bharat Mission; Jal Jeevan Mission; 15th Finance Commission |
| City Investments to Innovate, Integrate & Sustain | SDG 11.1, 11.2, 11.7,11.3 | Smart Cities Mission | |
| Swachh Bharat Mission | SDG 11 | ||
| Safaimitra Suraksha Challenge | SDG 11.3 | Swachh Bharat Mission | |
| Sustainable Cities Integrated Approach Pilot | SDG 11.1 | Swachh Bharat Mission, AMRUT | |
| National Mission on Clean Ganga | SDG 11 | NMCG | |
| ClimateSmart Cities Assessment Framework | SDG 11 | ||
| CapaCITIES | SDG 11.b | National Action Plan on Climate Change | |
| BASIIC | SDG 11 | Smart Cities Mission; Accessible India Mission | |
| UNEP-Capacity Building Initiative | SDG 11.6 | Swachh Bharat Mission; ClimateSmart Cities Assessment Framework | |
| CIFF - Low carbon and climate resilient cities | SDG 11.2, 11.6, 11.5, 11.7, 11.8 | Smart Cities Mission;ClimateSmart Cities Assessment Framework | |
| Climate Smart Cities - GIZ | SDG 11.3, 11.7, 11.9 | ClimateSmart Cities Assessment Framework | |
| Climate Centre for Cities | SDG 11.6.1, 11.6.2, 11.b,11.3 | Smart Cities Mission;Swachh Bharat Mission;AMRUT | |
| Inclusive Cities Centre | Ahmedabad Walled City Heritage Trust | SDG 11.1,11.2,11.3,11.4,11.7 | Smart Cities Mission |
| Infant,Toddler and Caregiver-Friendly Neighbourhoods | SDG 11.1, 11.2, 11.5, 11.6,11.7 | Smart Cities Mission | |
| Shaping Youth Futures | SDG 11.3 | National Urban Livelihood Mission | |
| Center for Digital Governance | National Urban Governance Platform | SDG 11.3, 11.A | National Urban Digital Mission; Smart Cities Mission |
| DataSmart Urban 95 | SDG 11.1,11.2,11.3,11.7 | National Urban Digital Mission; Smart Cities Mission | |
| Smartnet | SDG 11. | National Urban Digital Mission; Smart Cities Mission | |
| Water & Environment | NMCG - Addressing the urban drivers of river health in Ganga Basin | SDG 11.3, 11.4, 11.7 | NMCG, AMRUT 2.0, SBM 2.0, National Greening Mission, National Water Mission, Atal Bhujal Yojana, CAMPA |
| Developing an Urban Water Body Diadnostic Tool | SDG 11.4, 11.6 | AMRUT 2.0, National Mission for Clean Ganga | |
| Participatory and Inclusive Water Sensitive Urban Design for Sustainability and Resilience (PARIWAR) | SDG 11.5 | Jal Jeevan Mission; AMRUT; Smart Cities Mission; National Urban Livelihood Mission | |
| National-level sub-goals | 12.2 | 12.4 | 12.5 | 12.a | |||
|---|---|---|---|---|---|---|---|
| Indicators | Per capita fossil fuel consumption (in kg.) | Percentage use of nitrogenous fertilizer out of total N,P,K,(Nitrogen, Phosphorous, Potassium) | Hazardous waste generated per 1,000 population (Metric tonnes/ Annum) | Quantity of hazardous waste recycled/utilized to total hazardous waste generated(%) | Plastic waste generated per 1,000 population (Tonnes/ Annum) | Percentage of BMW treated to total quantity of BMW generated | Installed capacity of grid interactive bio power per 10 lakh population (MW) |
| India | 157.3 kg | *64.39% | 8.09 tonnes | 44.89% | 2.5 tonnes | 87% | 7.62 MW |
| Target | 64.1 kg | 64.1 kg | 4.04 tonnes | 100% | 1.27 tonnes | 100% | 21.81MW |
Source: NITI Aayog.(2021). SDG India Index and Dashboard 2020-21: Partnerships in the Decade of Action,NITI Aayog, Government of India.
*As of 2018-19, the use of nitrogenous fertilizer in the country out of total N, P, K is 64.39 percent, 7.39 percentage points higher than the ideal standards.
GOAL 12 |
|||
|---|---|---|---|
| CENTRE NAME | PROJECT NAME | LINKAGES TO SDG INDICATORS | LINKAGES TO GOVERNMENT OF INDIA'S MISSIONS (DIRECTLY/INDIRECTLY) |
| Centre for Smart and Sustainable Cities | Master Plan Delhi-2041 | SDG 12 | SCM, AMRUT, PMAY |
| Climate Centre for Cities | ClimateSmart Cities Assessment Framework | SDG 12 | |
| Swachh Bharat Mission | SDG 12 | ||
| Sustainable Cities Integrated Approach Pilot | SDG 12 | ||
| Climate Smart Cities | SDG 12.5 | Smart Cities Mission;Swachh Bharat Mission;AMRUT | |
| CIFF - Low carbon and climate resilient cities | SDG 12.3, 12.5 | Smart Cities Mission;ClimateSmart Cities Assessment Framework | |
| Inclusive Cities Centre | Ahmedabad Walled City Heritage Trust | SDG 12.b | Smart Cities Mission |
| Center for Urbanization and Economic Growth | India Smart Cities Fellowship Programme (Phase-II) | SDG 12.b | Smart Cities Mission |
| Sustainable, Healthy, Learning Cities and Neighborhoods | SDG 12.7 | Smart Cities Mission | |
| National-level sub-goals | 13.1 | 13.2 | |||
|---|---|---|---|---|---|
| Indicators | Number of human lives lost per 1 crore population due to extreme weather events | Disaster preparedness score as per Disaster Resilience Index | Percentage of renewable energy out of total installed generating capacity (including allocated shares) | CO2 saved from LED bulbs per 1,000 population (Tonnes) | Disability Adjusted Life Years (DALY) rate attributable to air pollution (per 1,00,000 population) |
| India | 15 | 19.2 | 36.37% | 38.6 tonnes | 3469 |
| Target | 0 | 50 | 40% | 103.22 tonnes | 1442 |
Source: NITI Aayog.(2021). SDG India Index and Dashboard 2020-21: Partnerships in the Decade of Action,NITI Aayog, Government of India.
GOAL 13 |
|||
|---|---|---|---|
| CENTRE NAME | PROJECT NAME | LINKAGES TO SDG INDICATORS | LINKAGES TO GOVERNMENT OF INDIA'S MISSIONS (DIRECTLY/INDIRECTLY) |
| Centre for Smart and Sustainable Cities | Master Plan Delhi-2041 | SDG 13 | SCM, AMRUT, PMAY |
| Infant,Toddler and Caregiver-Friendly Neighbourhoods | SDG 13 | Smart Cities Mission | |
| Climate Centre for Cities | Capacity Building for Low Carbon & Climate Resillient City Development in India | SDG 13.2, 13.1 | National Action Plan on Climate Change |
| CIFF - Low carbon and climate resilient cities | SDG 13.1, 13.2 | Smart Cities Mission;ClimateSmart Cities Assessment Framework | |
| Climate Smart Cities - GIZ | SDG 13.1, 13.3 | ClimateSmart Cities Assessment Framework | |
| ClimateSmart Cities Assessment Framework | SDG 13 | Smart Cities Mission | |
| Climate Smart Cities | SDG 13.1, 13.2, 13.3 | Smart Cities Mission;Swachh Bharat Mission;AMRUT | |
| Inclusive Cities Centre | Ahmedabad Walled City Heritage Trust | SDG 13.1 | Smart Cities Mission |
| Center for Urbanization and Economic Growth | Morgenstadt Global Smart Cities Initiative | SDG 13.1 | Smart Cities Mission; PMAY-Urban |
| Urban Resilience and Adaptation for India and Mongolia (URGENT) | SDG 13.1, 13.3 | No Direct | |
| India Smart Cities Fellowship Programme (Phase-II) | SDG 13 | Smart Cities Mission | |
| Sustainable, Healthy, Learning Cities and Neighborhoods | SDG 13.2, 13.b | Smart Cities Mission | Water & Environment | Participatory and Inclusive Water Sensitive Urban Design for Sustainability and Resilience (PARIWAR) | SDG 13.1,13.2,13.3 | Jal Jeevan Mission; AMRUT; Smart Cities Mission; National Urban Livelihood Mission |
| National-level sub-goals | 14.1 | 14.2 | 14.3 | 14.7 | |
|---|---|---|---|---|---|
| Indicators | Mean shore zone coastal water quality - Biochemical Oxygen Demand (BOD) (mg/l)* | Mean shore zone coastal water quality - Total Nitrogen (TN) (μmol/l)* | Percentage increase in area under mangroves | Average marine acidity (pH) measured atrepresentative sampling stations in the shore zone* | Percentage of available potential area developed under aquaculture |
| India | 1.99 Highest in Maharashtra 0.39 Lowest in Odisha | 65 Highest in Odisha 20.12 Lowest in Goa | 4975 sq. km | - | 30% of 0.53 million hectares |
| Target | - | - | - | - | - |
Source: NITI Aayog.(2021). SDG India Index and Dashboard 2020-21: Partnerships in the Decade of Action,NITI Aayog, Government of India.
GOAL 14 |
|||
|---|---|---|---|
| CENTRE NAME | PROJECT NAME | LINKAGES TO SDG INDICATORS | LINKAGES TO GOVERNMENT OF INDIA'S MISSIONS (DIRECTLY/INDIRECTLY) |
| Centre for Smart and Sustainable Cities | Master Plan Delhi-2041 | SDG 14 | SCM, AMRUT, PMAY |
| Center for Urbanization and Economic Growth | India Smart Cities Fellowship Programme (Phase-II) | SDG 14 | Smart Cities Mission |
| National-level sub-goals | 15.1 | 15.2 | 15.3 | 15.7 | |||
|---|---|---|---|---|---|---|---|
| Indicators | Forest cover as a percent- age of total geographical area | Tree cover as a percentage of total geographical area | Combined 15.1+15.2 | Percentage of area covered under afforestation schemes to the total geographical area | Percentage of degraded land over total land area | Percentage increase in area of desertification | Number of cases under Wildlife Protection Act (1972) per million hectares of protected area |
| India | *21.67% | *2.89% | *25% | 1.7 million hectares | 28% | Between 2003-05 and 2011-13, desertification in India increased by 1.98 percent | 15 |
| Target | - | - | 33% | - | 5.46% | 0 | 0 |
Source: NITI Aayog.(2021). SDG India Index and Dashboard 2020-21: Partnerships in the Decade of Action,NITI Aayog, Government of India.
*The total forest cover of the country is 7,12,249 sq.km which is 21.67 percent of the geographic area. Tree cover accounts for 2.89 percent of the total geographical area, bringing around 25 percent of the geographical area under forest and tree cover.
GOAL 15 |
|||
|---|---|---|---|
| CENTRE NAME | PROJECT NAME | LINKAGES TO SDG INDICATORS | LINKAGES TO GOVERNMENT OF INDIA'S MISSIONS (DIRECTLY/INDIRECTLY) |
| Centre for Smart and Sustainable Cities | Master Plan Delhi-2041 | SDG 15 | SCM, AMRUT, PMAY | Center for Urbanization and Economic Growth | India Smart Cities Fellowship Programme (Phase-II) | SDG 15 | Smart Cities Mission |
| Climate Centre for Cities | Capacity Building for Low Carbon & Climate Resillient City Development in India | SDG 15.1, 15.9 | National Action Plan on Climate Change |
| ClimateSmart Cities Assessment Framework | SDG 15 | ||
| CIFF - Low carbon and climate resilient cities | SDG 15.1, 15.5 | Smart Cities Mission;ClimateSmart Cities Assessment Framework | |
| Climate Centre for Cities | SDG 15.1, 15.4.2, 15.5, 15.8, 15.9, 15.a | Smart Cities Mission;Swachh Bharat Mission;AMRUT | |
| National-level sub-goals | 16.1 | 16.2 | 16.3 | 16.5 | 16.9 | |||
|---|---|---|---|---|---|---|---|---|
| Indicators | Murders per 1,00,000 population | Cognizable crimes against children per 1,00,000 population | Number of victims of human trafficking per 10 lakh population | Number of missing children per 1,00,000 child population | No. of courts per 1,00,000 population | Cases under Prevention of Corruption Act and related sections of IPC per 10 lakh Population | Percentage of births registered | Percentage of population covered under Aadhaar |
| India | 2.2 | 33 | 05 | 16 | 1.85 | 3.17 | 89.3%(in 2018) | 93.24% |
| Target | 01 | 00 | 00 | 00 | 4.25 | 0.19 | 100% | 100% |
Source: NITI Aayog.(2021). SDG India Index and Dashboard 2020-21: Partnerships in the Decade of Action,NITI Aayog, Government of India.
GOAL 16 |
|||
|---|---|---|---|
| CENTRE NAME | PROJECT NAME | LINKAGES TO SDG INDICATORS | LINKAGES TO GOVERNMENT OF INDIA'S MISSIONS (DIRECTLY/INDIRECTLY) |
| Centre for Digital Governance | Online Building Permission System | SDG 16 | |
| National Urban Governance Platform | SDG 16.6 | National Urban Digital Mission; Smart Cities Mission | |
| Center for Urbanization and Economic Growth | Integrated Capacity Building Platform | SDG 16.6 | PMAY-U; Smart Cities Mission; HRIDAY; Swachh Bharat Mission; National Urban Livelihood Mission; AMRUT |
| India Smart Cities Fellowship Programme (Phase-II) | SDG 16.6 | Smart Cities Mission | |
| Sustainable, Healthy, Learning Cities and Neighborhoods | SDG 16.6, 16.7,16.8 | Smart Cities Mission | |
| Scale and Nature of Deprivation among Children and Adolescents in Urban India | SDG 16.1, 16.2, 16.10 | Smart Cities Mission | |
| Centre for Smart and Sustainable Cities | Master Plan Delhi-2041 | SDG 16 | SCM, AMRUT, PMAY |
| Smart Data & Inclusive Cities | SDG 16 | Smart Cities Mission | |
| Inclusive Cities Centre | Infant,Toddler and Caregiver-Friendly Neighbourhoods | SDG 16.1, 16.2 | Smart Cities Mission |
GOAL 17 |
|||
|---|---|---|---|
| CENTRE NAME | PROJECT NAME | LINKAGES TO SDG INDICATORS | LINKAGES TO GOVERNMENT OF INDIA'S MISSIONS (DIRECTLY/INDIRECTLY) |
| Centre for Smart and Sustainable Cities | Master Plan Delhi-2041 | SDG 17 | SCM, AMRUT, PMAY |
| Smart Data & Inclusive Cities | SDG 17 | Smart Cities Mission | |
| Inclusive Cities Centre | Ahmedabad Walled City Heritage Trust | SDG 17.17 | Smart Cities Mission |
| Climate Centre for Cities | Climate Centre for Cities | SDG 17.17, 17.16,17.8 | Smart Cities Mission;Swachh Bharat Mission;AMRUT |
| Center for Urbanization and Economic Growth | Smart Data and Inclusive Cities | SDG 17.16,17.17 | Smart Cities Mission |
| Morgenstadt Global Smart Cities Initiative | SDG 17.9 | Smart Cities Mission; PMAY-Urban | |
| Federal Institute for Research on Building, Urban Affairs & Spatial Development | SDG 17.6, 17.18 | Smart Cities Mission | |
| Sustainable, Healthy, Learning Cities and Neighborhoods | SDG 17.6, 17.7, 17.9, 17.14, 17.15, 17.16, 17.18 | Smart Cities Mission | |
| Water & Environment | Participatory and Inclusive Water Sensitive Urban Design for Sustainability and Resilience (PARIWAR) | SDG 17.7, 17.17 | Jal Jeevan Mission; AMRUT; Smart Cities Mission; National Urban Livelihood Mission |
SDG 1: NO POVERTY
End Poverty in all its forms everywhere
By 2030, eradicate extreme poverty for all people everywhere, currently measured as people living on less than $1.25 a day
Project Name
Knowledge Products
No Projects
By 2030, reduce at least by half the proportion of men, women and children of all ages living in poverty in all its dimensions according to national definitions
Project Name
Knowledge Products
No Projects
Implement nationally appropriate social protection systems and measures for all, including floors, and by 2030 achieve substantial coverage of the poor and the vulnerable
Project Name
Knowledge Products
No Projects
By 2030, ensure that all men and women, in particular the poor and the vulnerable, have equal rights to economic resources, as well as access to basic services, ownership and control over land and other forms of property, inheritance, natural resources, appropriate new technology and financial services, including microfinance
Project Name
Knowledge Products
No Projects
Ensure significant mobilization of resources from a variety of sources, including through enhanced development cooperation, in order to provide adequate and predictable means for developing countries, in particular least developed countries, to implement programmes and policies to end poverty in all its dimensions
Project Name
Knowledge Products
No Projects
SDG 2: ZERO HUNGER
End hunger, achieve food security, improve sanitation and promote sustainable agriculture
By 2030, end hunger and ensure access by all people, in particular the poor and people in vulnerable situations, including infants, to safe, nutritious and sufficient food all year round
Project Name
1. India Smart Cities Fellowship Programme
Knowledge Products
By 2030, end all forms of malnutrition, including achieving, by 2025, the internationally agreed targets on stunting and wasting in children under 5 years of age, and address the nutritional needs of adolescent girls, pregnant and lactating women and older persons
Project Name
Knowledge Products
1. Scale and Nature of Deprivation among Children in Urban India
1. Scale and Nature of Deprivation among Children in Urban India
1. Scale and Nature of Deprivation among Children in Urban India
1. Scale and Nature of Deprivation among Children in Urban India
By 2030, ensure sustainable food production systems and implement resilient agricultural practices that increase productivity and production, that help maintain ecosystems, that strengthen capacity for adaptation to climate change, extreme weather, drought, flooding and other disasters and that progressively improve land and soil quality
Project Name
Knowledge Products
No Projects
Increase investment, including through enhanced international cooperation, in rural infrastructure, agricultural research and extension services, technology development and plant and livestock gene banks in order to enhance agricultural productive capacity in developing countries, in particular least developed countries
Project Name
Knowledge Products
No Projects
Correct and prevent trade restrictions and distortions in world agricultural markets, including through the parallel elimination of all forms of agricultural export subsidies and all export measures with equivalent effect, in accordance with the mandate of the Doha Development Round
Project Name
Knowledge Products
No Projects
SDG 3: GOOD HEALTH AND WELL BEING
Ensure healthy lives and promote well-being for all at all ages
Achieve universal health coverage, including financial risk protection, access to quality essential health-care services and access to safe, effective, quality and affordable essential medicines and vaccines for all
Project Name
Knowledge Products
1. Ahmedabad Walled City Heritage Trust
2. Federal Institute for Research on Building, Urban Affairs & Spatial Development
3. City Investments to Innovate, Integrate & Sustain
4.India Smart Cities Fellowship Program
5. Sustainable, Healthy, Learning Cities and Neighborhoods
6. Scale and Nature of Deprivation among Children in Urban India
Strengthen the implementation of the World Health Organization Framework Convention on Tobacco Control in all countries, as appropriate
Project Name
Knowledge Products
No Projects
SDG 4: QUALITY EDUCATION
Ensure inclusive and equitable quality education and promote lifelong learning opportunities for all
By 2030, ensure that all youth and a substantial proportion of adults, both men and women, achieve literacy and numeracy
Project Name
Knowledge Products
No Projects
Build and upgrade education facilities that are child, disability and gender sensitive and provide safe, non-violent, inclusive and effective learning environments for all
Project Name
Knowledge Products
1. Federal Institute for Research on Building, Urban Affairs & Spatial Development
2. Sustainable, Healthy, Learning Cities and Neighborhoods
3.India Smart Cities Fellowship Program
4.Implementing Transit Oriented Development in Indian Smart Cities
By 2020, substantially expand globally the number of scholarships available to developing countries, in particular least developed countries, small island developing States and African countries, for enrolment in higher education, including vocational training and information and communications technology, technical, engineering and scientific programmes, in developed countries and other developing countries
Project Name
Knowledge Products
SDG 5: GENDER EQUALITY
Achieve gender equality and empower all women and girls
Eliminate all forms of violence against all women and girls in the public and private spheres, including trafficking and sexual and other types of exploitation
Project Name
Knowledge Products
1. Sustainable, Healthy, Learning Cities and Neighborhoods
2. Scale and Nature of Deprivation among Children in Urban India
Recognize and value unpaid care and domestic work through the provision of public services, infrastructure and social protection policies and the promotion of shared responsibility within the household and the family as nationally appropriate
Project Name
Knowledge Products
1. Scale and Nature of Deprivation among Children in Urban India
SDG 6: CLEAN WATER AND SANITATION
Ensure availability and sustainable management of water and sanitation for all
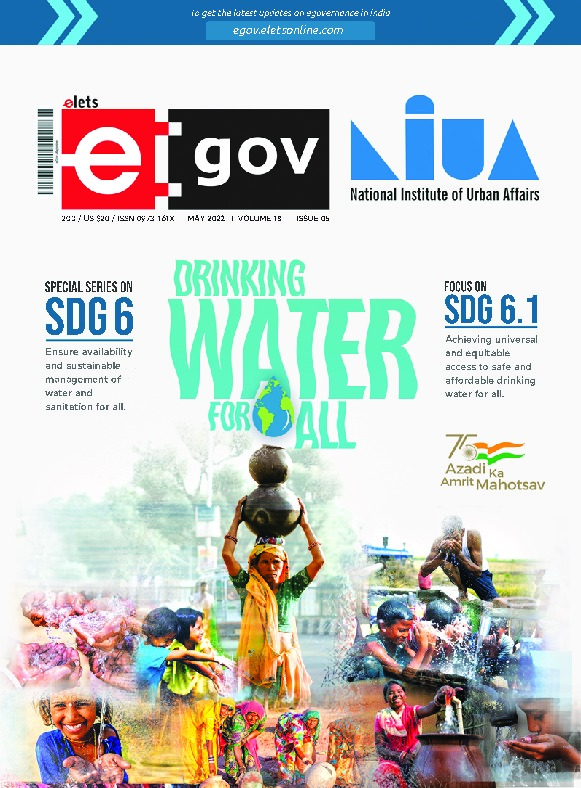
By 2030, achieve universal and equitable access to safe and affordable drinking water for all
Project Name
1. Ahmedabad Walled City Heritage Trust
2. Federal Institute for Research on Building, Urban Affairs & Spatial Development
3. City Investments to Innovate, Integrate & Sustain
4. Innovation Hub for Urban Water, Sanitation & Hygiene
6. Sustainable, Healthy, Learning Cities and Neighborhoods
7. Scale and Nature of Deprivation among Children in Urban India
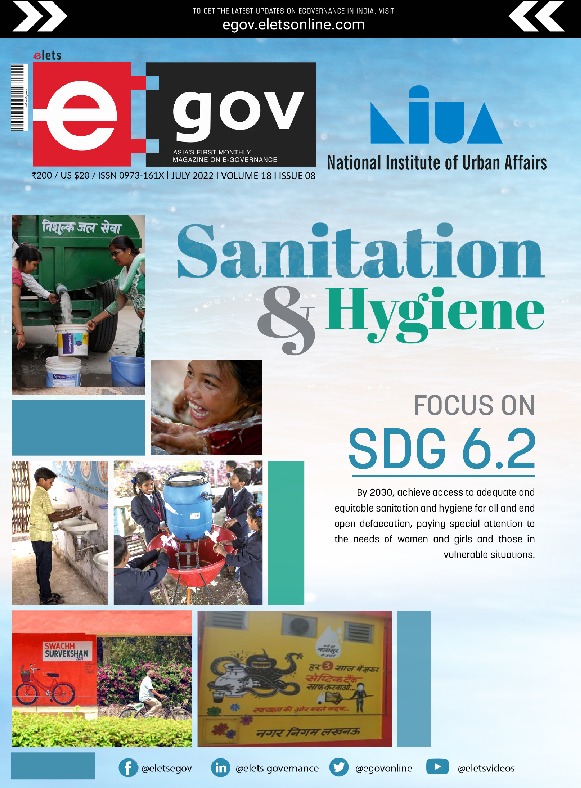
By 2030, achieve access to adequate and equitable sanitation and hygiene for all and end.open defecation, paying special attention to the needs of women and girls and those in vulnerable situations
Project Name
1. Ahmedabad Walled City Heritage Trust
2. City Investments to Innovate, Integrate & Sustain
3. Innovation Hub for Urban Water, Sanitation & Hygiene
6. Sustainable Cities Integrated Approach Pilot
7. Sustainable, Healthy, Learning Cities and Neighborhoods
8. Scale and Nature of Deprivation among Children in Urban India
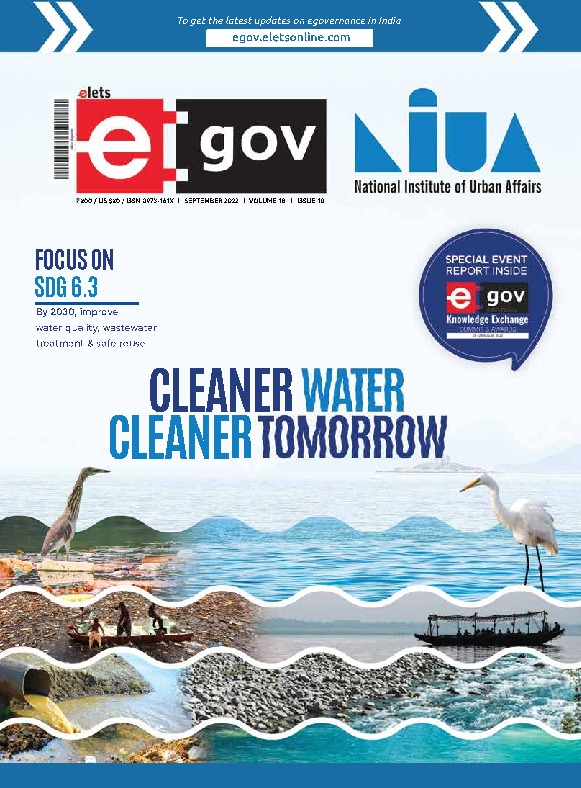
By 2030, improve water quality by reducing pollution, eliminating dumping and minimizing release of hazardous chemicals and materials, halving the proportion of untreated wastewater and substantially increasing recycling and safe reuse globally
Support and strengthen the participation of local communities in improving water and sanitation management
Project Name
Knowledge Products
1. Innovation Hub for Urban Water, Sanitation & Hygiene
3.India Smart Cities Fellowship Program
5. Sustainable Cities Integrated Approach Pilot
6. Sustainable, Healthy, Learning Cities and Neighborhoods
7. Integrated Capacity Building Platform
SDG 7: AFFORDABLE AND CLEAN ENERGY
Ensure access to affordable, reliable, sustainable and modern energy for all
By 2030, enhance international cooperation to facilitate access to clean energy research and technology, including renewable energy, energy efficiency and advanced and cleaner fossil-fuel technology, and promote investment in energy infrastructure and clean energy technology
Project Name
Knowledge Products
2.Implementing Transit Oriented Development in Indian Smart Cities
By 2030, expand infrastructure and upgrade technology for supplying modern and sustainable energy services for all in developing countries, in particular least developed countries, small island developing States and landlocked developing countries, in accordance with their respective programmes of support
Project Name
Knowledge Products
1.Implementing Transit Oriented Development in Indian Smart Cities
SDG 8: DECENT WORK AND ECONOMIC GROWTH
Promote sustained, inclusive and sustainable economic growth, full and productive employment and decent work for all
Achieve higher levels of economic productivity through diversification, technological upgrading and innovation, including through a focus on high-value added and labour-intensive sectors
Project Name
Knowledge Products
1. 14th Finance Commission Cell
2.Implementing Transit Oriented Development in Indian Smart Cities
Promote development-oriented policies that support productive activities, decent job creation, entrepreneurship, creativity and innovation, and encourage the formalization and growth of micro-, small- and medium-sized enterprises, including through access to financial services
Project Name
Knowledge Products
1. Ahmedabad Walled City Heritage Trust
2. 14th Finance Commission Cell
3.India Smart Cities Fellowship Program
4.Implementing Transit Oriented Development in Indian Smart Cities
6. Sustainable, Healthy, Learning Cities and Neighborhoods
7. Scale and Nature of Deprivation among Children in Urban India
Improve progressively, through 2030, global resource efficiency in consumption and production and endeavour to decouple economic growth from environmental degradation, in accordance with the 10‑Year Framework of Programmes on Sustainable Consumption and Production, with developed countries taking the lead
Project Name
Knowledge Products
1.Implementing Transit Oriented Development in Indian Smart Cities
By 2030, achieve full and productive employment and decent work for all women and men, including for young people and persons with disabilities, and equal pay for work of equal value
Project Name
Knowledge Products
1. Sustainable, Healthy, Learning Cities and Neighborhoods
2. Scale and Nature of Deprivation among Children in Urban India
Take immediate and effective measures to eradicate forced labour, end modern slavery and human trafficking and secure the prohibition and elimination of the worst forms of child labour, including recruitment and use of child soldiers, and by 2025 end child labour in all its forms
Project Name
Knowledge Products
1. Scale and Nature of Deprivation among Children in Urban India
Protect labour rights and promote safe and secure working environments for all workers, including migrant workers, in particular women migrants, and those in precarious employment
Project Name
Knowledge Products
1. Sustainable, Healthy, Learning Cities and Neighborhoods
2. Scale and Nature of Deprivation among Children in Urban India
Strengthen the capacity of domestic financial institutions to encourage and expand access to banking, insurance and financial services for all
Project Name
Knowledge Products
1. Sustainable, Healthy, Learning Cities and Neighborhoods
4.Implementing Transit Oriented Development in Indian Smart Cities
By 2020, develop and operationalize a global strategy for youth employment and implement the Global Jobs Pact of the International Labour Organization
Project Name
Knowledge Products
No Projects
SDG 9: INDUSTRY, INNOVATION AND INFRASTRUCTUR
Build resilient infrastructure, promote inclusive and sustainable and foster innovation
Promote inclusive and sustainable industrialization and, by 2030, significantly raise industry’s share of employment and gross domestic product, in line with national circumstances, and double its share in least developed countries
Project Name
Knowledge Products
1.Implementing Transit Oriented Development in Indian Smart Cities
By 2030, upgrade infrastructure and retrofit industries to make them sustainable, with increased resource-use efficiency and greater adoption of clean and environmentally sound technologies and industrial processes, with all countries taking action in accordance with their respective capabilities
Project Name
Knowledge Products
1.Implementing Transit Oriented Development in Indian Smart Cities
Enhance scientific research, upgrade the technological capabilities of industrial sectors in all countries, in particular developing countries, including, by 2030, encouraging innovation and substantially increasing the number of research and development workers per 1 million people and public and private research and development spending
Project Name
Knowledge Products
1. Innovation Hub for Urban Water, Sanitation & Hygiene
2.Implementing Transit Oriented Development in Indian Smart Cities
SDG 10: REDUCED INEQUALITIES
Reduce inequality within and among countries
By 2030, empower and promote the social, economic and political inclusion of all, irrespective of age, sex, disability, race, ethnicity, origin, religion or economic or other status
Improve the regulation and monitoring of global financial markets and institutions and strengthen the implementation of such regulations
Project Name
Knowledge Products
No Projects
Encourage official development assistance and financial flows, including foreign direct investment, to States where the need is greatest, in particular least developed countries, African countries, small island developing States and landlocked developing countries, in accordance with their national plans and programmes
Project Name
Knowledge Products
No Projects
By 2030, reduce to less than 3 per cent the transaction costs of migrant remittances and eliminate remittance corridors with costs higher than 5 per cent
Project Name
Knowledge Products
No Projects
SDG 11: SUSTAINABLE CITIES AND COMMUNITIES
Make cities and human settlements inclusive, safe, resilient and sustainable
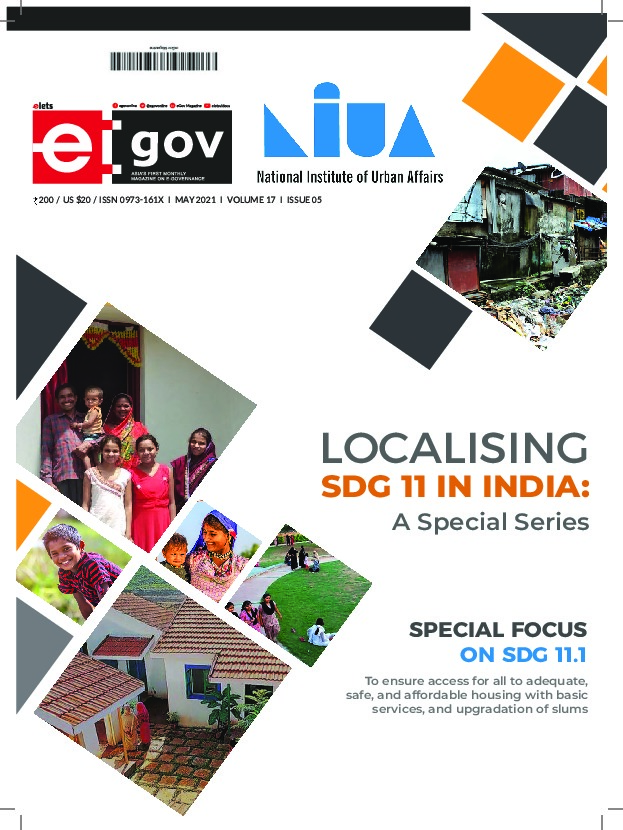
By 2030, ensure access for all to adequate, safe and affordable housing and basic services and upgrade slums
Project Name
1. Ahmedabad Walled City Heritage Trust
2. Federal Institute for Research on Building, Urban Affairs & Spatial Development
3. City Investments to Innovate, Integrate & Sustain
4.Implementing Transit Oriented Development in Indian Smart Cities
6. Sustainable, Healthy, Learning Cities and Neighborhoods
7. Scale and Nature of Deprivation among Children in Urban India
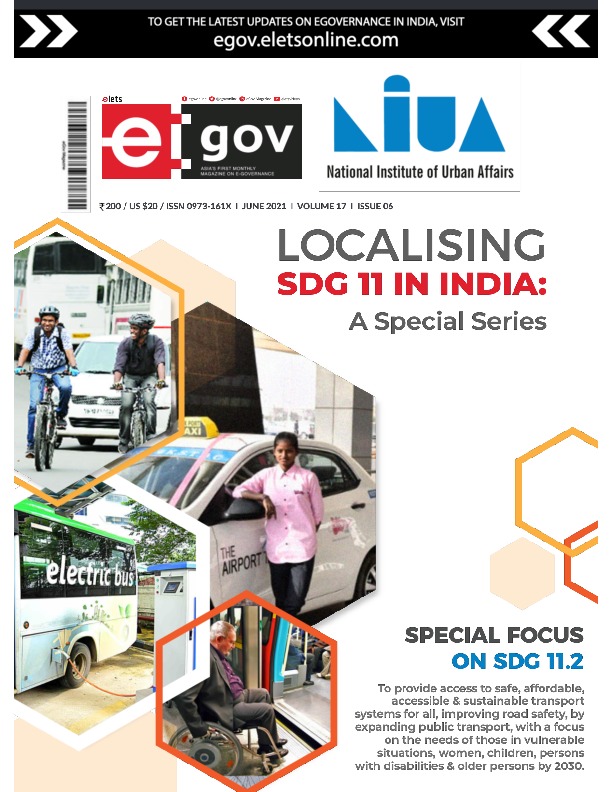
By 2030, provide access to safe, affordable, accessible and sustainable transport systems for all, improving road safety, notably by expanding public transport, with special attention to the needs of those in vulnerable situations, women, children, persons with disabilities and older persons
Project Name
1. Ahmedabad Walled City Heritage Trust
2. Building Accessible, Safe & Inclusive Indian Cities
3. Federal Institute for Research on Building, Urban Affairs & Spatial Development
4. City Investments to Innovate, Integrate & Sustain
6.India Smart Cities Fellowship Program
7.Implementing Transit Oriented Development in Indian Smart Cities
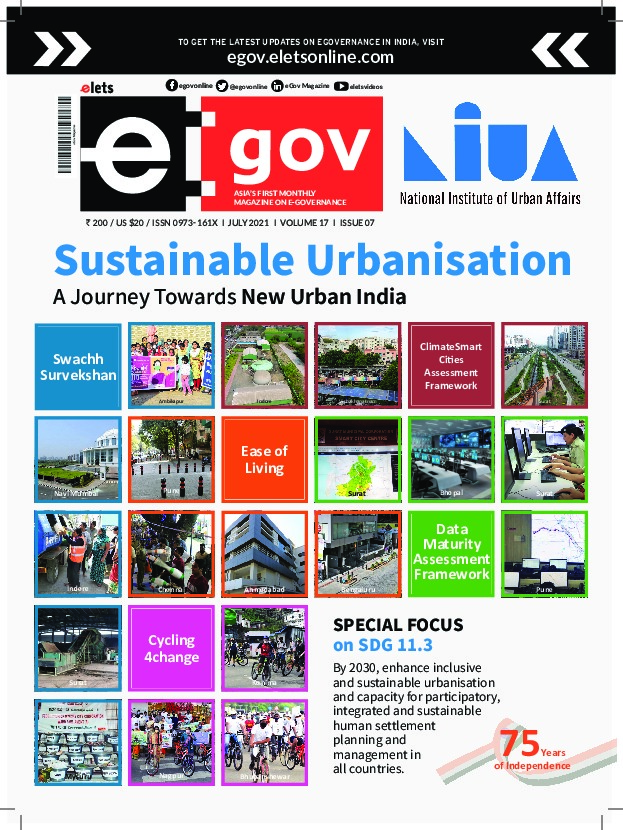
By 2030, enhance inclusive and sustainable urbanization and capacity for participatory, integrated and sustainable human settlement planning and management in all countries
Project Name
1. Ahmedabad Walled City Heritage Trust
2. Federal Institute for Research on Building, Urban Affairs & Spatial Development
3. City Investments to Innovate, Integrate & Sustain
5.Implementing Transit Oriented Development in Indian Smart Cities
7. Sustainable, Healthy, Learning Cities and Neighborhoods
8. Integrated Capacity Building Platform
By 2030, reduce the adverse per capita environmental impact of cities, including by paying special attention to air quality and municipal and other waste management
Project Name
Knowledge Products
1. Federal Institute for Research on Building, Urban Affairs & Spatial Development
2. National Mission on Clean Ganga
4.India Smart Cities Fellowship Program
6. Sustainable Cities Integrated Approach Pilot
7. Sustainable, Healthy, Learning Cities and Neighborhoods
8. Morgenstadt Global Smart Cities Initiative
By 2030, provide universal access to safe, inclusive and accessible, green and public spaces, in particular for women and children, older persons and persons with disabilities
Project Name
Knowledge Products
No Projects
SDG 12: RESPONSIBLE CONSUMPTION AND PRODUCTION
Ensure sustainable consumption and production patterns
By 2030, halve per capita global food waste at the retail and consumer levels and reduce food losses along production and supply chains, including post-harvest losses
Project Name
No Projects
Knowledge Products
Encourage companies, especially large and transnational companies, to adopt sustainable practices and to integrate sustainability information into their reporting cycle
Project Name
No Projects
Knowledge Products
Support developing countries to strengthen their scientific and technological capacity to move towards more sustainable patterns of consumption and production
Project Name
No Projects
Knowledge Products
SDG 13: CLIMATE ACTION
Take urgent action to combat climate change and its impacts
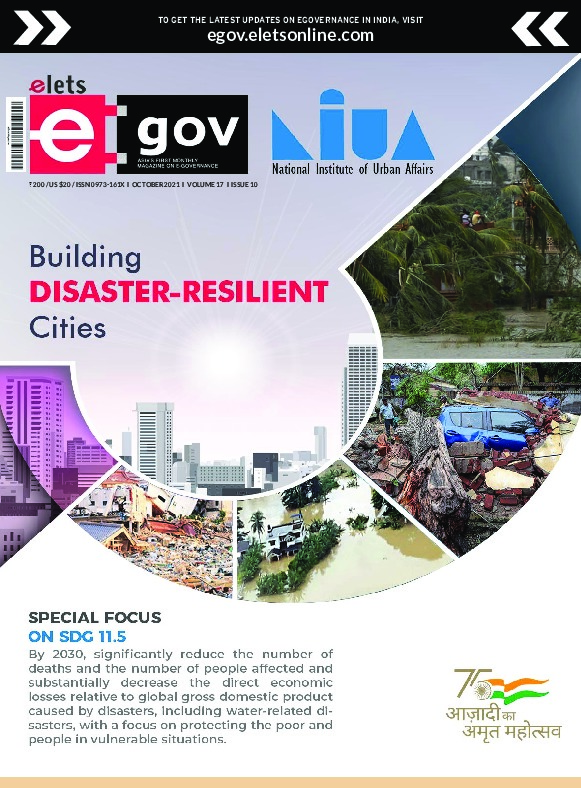
Strengthen resilience and adaptive capacity to climate-related hazards and natural disasters in all countries
Project Name
1. Ahmedabad Walled City Heritage Trust
2. Capacity Building for Low Carbon & Climate Resillient City Development in India
4.India Smart Cities Fellowship Program
5.Implementing Transit Oriented Development in Indian Smart Cities
Knowledge Products
Integrate climate change measures into national policies, strategies and planning
SDG 14: LIFE BELOW WATER
Conserve and sustainably use the oceans, seas and marine resources for sustainable development
Minimize and address the impacts of ocean acidification, including through enhanced scientific cooperation at all levels
Project Name
No Projects
Knowledge Products
By 2020, effectively regulate harvesting and end overfishing, illegal, unreported and unregulated fishing and destructive fishing practices and implement science-based management plans, in order to restore fish stocks in the shortest time feasible, at least to levels that can produce maximum sustainable yield as determined by their biological characteristics
Project Name
No Projects
Knowledge Products
By 2020, conserve at least 10 per cent of coastal and marine areas, consistent with national and international law and based on the best available scientific information
Project Name
No Projects
Knowledge Products
Provide access for small-scale artisanal fishers to marine resources and markets
Project Name
No Projects
Knowledge Products
Enhance the conservation and sustainable use of oceans and their resources by implementing international law as reflected in the United Nations Convention on the Law of the Sea, which provides the legal framework for the conservation and sustainable use of oceans and their resources, as recalled in paragraph 158 of “The future we want”
Project Name
No Projects
Knowledge Products
SDG 15: LIFE ON LAND
Protect, restore and promote sustainable use of terrestrial ecosystems, sustainably manage forests, combat desertification, and halt and reverse land degradation and halt biodiversity loss
By 2020, ensure the conservation, restoration and sustainable use of terrestrial and inland freshwater ecosystems and their services, in particular forests, wetlands, mountains and drylands, in line with obligations under international agreements
Knowledge Products
Promote fair and equitable sharing of the benefits arising from the utilization of genetic resources and promote appropriate access to such resources, as internationally agreed
Project Name
No Projects
Knowledge Products
Take urgent action to end poaching and trafficking of protected species of flora and fauna and address both demand and supply of illegal wildlife products
Project Name
No Projects
Knowledge Products
SDG 16: PEACE, JUSTICE AND STRONG INSTITUTIONS
Promote peaceful and inclusive societies for sustainable development, provide access to justice for all and build effective, accountable and inclusive institutions at all levels
Promote the rule of law at the national and international levels and ensure equal access to justice for all
Project Name
No Projects
Knowledge Products
By 2030, significantly reduce illicit financial and arms flows, strengthen the recovery and return of stolen assets and combat all forms of organized crime
Project Name
No Projects
Knowledge Products
Substantially reduce corruption and bribery in all their forms
Project Name
Knowledge Products
By 2030, provide legal identity for all, including birth registration
Project Name
No Projects
Knowledge Products
Promote and enforce non-discriminatory laws and policies for sustainable development
Project Name
No Projects
Knowledge Products
Mobilize additional financial resources for developing countries from multiple sources
Project Name
No Projects
Knowledge Products
Assist developing countries in attaining long-term debt sustainability through coordinated policies aimed at fostering debt financing, debt relief and debt restructuring, as appropriate, and address the external debt of highly indebted poor countries to reduce debt distress sources
Project Name
No Projects
Knowledge Products
Adopt and implement investment promotion regimes for least developed countries
Project Name
No Projects
Knowledge Products
Enhance international support for implementing effective and targeted capacity-building in developing countries to support national plans to implement all the Sustainable Development Goals, including through North-South, South-South and triangular cooperation
Knowledge Products
Significantly increase the exports of developing countries, in particular with a view to doubling the least developed countries’ share of global exports by 2020
Project Name
No Projects
Knowledge Products
Realize timely implementation of duty-free and quota-free market access on a lasting basis for all least developed countries, consistent with World Trade Organization decisions, including by ensuring that preferential rules of origin applicable to imports from least developed countries are transparent and simple, and contribute to facilitating market access
Project Name
No Projects
Knowledge Products
Enhance global macroeconomic stability, including through policy coordination and policy coherence
Project Name
No Projects
Knowledge Products
